

Over the next week, you’re going to hear a lot about how high prices are, how much more a turkey dinner cost than a year ago. But when you hear somebody, say the word “hyperinflation”, remember this picture:
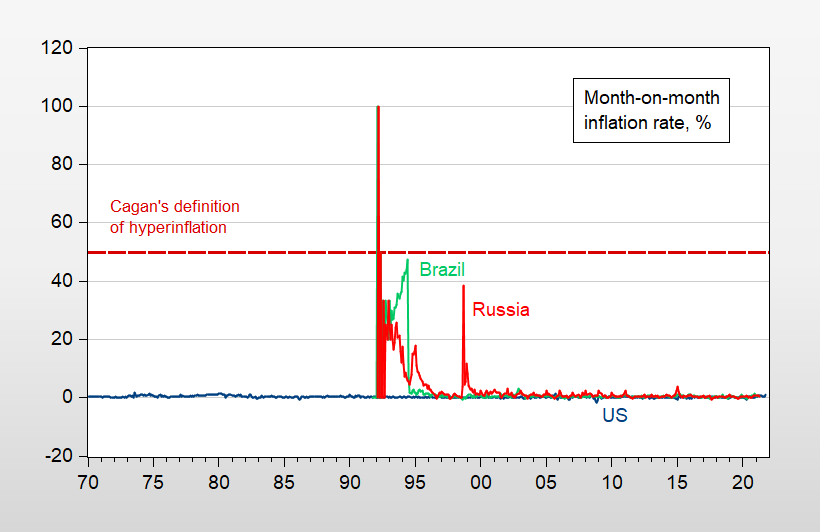
Figure 1: Month on month headline CPI inflation for US (blue), Brazil (light green), Russia (red), all in percent per month. Cagan’s definition of hyperinflation (red dashed line at 50%). Source: BLS via FRED, Ha, Kose, Ohnsorge, and author’s calculations.
What about the oft-cited example of 1920’s Germany. We don’t have inflation rates measured against a bundle of consumption goods, but we do have a depreciation rate of the Reichsmark against the “gold” mark:
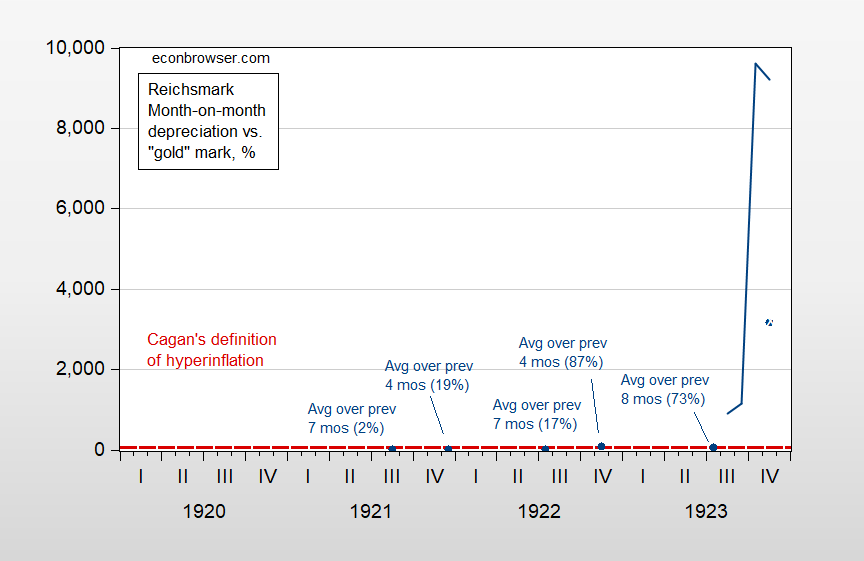
Figure 2: Month-on-month depreciation of Reichsmark against “gold” mark (blue dots and line). All 1923 observations approximate since data pertain to varying days in each month. Cagan’s definition of hyperinflation (red dashed line at 50%). Source: W.C. Fisher/Wikipedia, and author’s calculations.


Comments
Log in or sign up to join the conversation.