

The Short-Term Trend
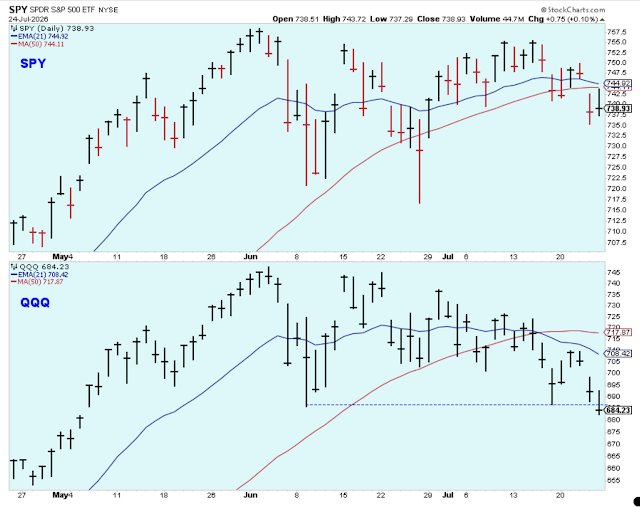
The short-term downtrend continues, although the PMO index is now near the bottom of its range. This trend isn't like most downtrends because it is as much about rotation as it is about selling. However, rates really spiked higher on Thursday, and that brought down all stocks.
I heard some people talk about selling on Thursday and Friday, but it was too late for me to be selling. That isn't the way I want to trade stocks. For me, when the PMO at the top of the range and the short-term downtrend starts, I have to raise some cash so that I won't feel as much pressure to sell when the PMO is near the bottom of the range.
Easier to say than to do, however. Note to self, raise a bit of cash when the PMO is at the top of the range and raise a bit more cash on the first signs of a new downtrend.

The 10-day call/put was slow to roll over, but it got serious with a big red bar on Friday. Sometimes this index will turn higher just before the market turns upward too, so I will be watching.

The number of net new highs/new lows dipped under the zero-level for the first time since the market corrected just before the Presidential election. This tells me that this selling is more serious than a periodic, short-term sell-off, and maybe that is a good thing.
There is a lot of froth and excess in this market and it is now being rinsed out. At least, I hope so. Also, keep in mind that when new lows spike higher while the PMO is near its lows, it often means that the downtrend is bottoming out. It can be a signal to start looking for signs of the next uptrend.

The chart below shows just the number of new lows, and what jumps out is that the new lows are all in the NASDAQ, which points to the rotation out of high-PE technology and into lower-PE cyclicals. The bad news is that our favorite tech stocks now have a market rotation headwind, but the good news is that this is normal for the second stage of a rate-cycle within a strong bull market.

The bullish percents are still moving lower, and they don't look like they'll see the bottom falling out of the market. Sometimes these bullish percents will accelerate lower just as the market is starting to bottom out, and then within the next few days they reverse back up above the moving average as a confirmation of a new uptrend. Early January and early February are good examples.

Since we are in a correction, this is a good time for me to step back and ask myself how well I have been able to stick to my trading plan so far this year. I will give you the good and the bad.
There were many signs of froth in the market, and I did well either avoiding these or selling quickly to capture profits. For instance, I jumped into a number of the hot IPO stocks and I did well buying into a number of these IPOs and selling into the price spikes. I did a very good job using the PMO as a timing tool to tell me when to get in and out of these stocks.
I also feel good about moving some of the IPO profits out of my brokerage account and into a bank account so that I couldn't spend it on more stocks. Protecting that cash was a very good move which I plan on repeating.
Where I didn't do as well is with my high-conviction stocks. I feel very strongly about the semiconductor and alternate-energy industries, so I held onto these stocks to the point where I ignored some technical sell signals. That's not good. Now I have several stocks that I am looking to unload on strength, and I'm not happy about it.
The Longer-Term Outlook
The ECRI index ticked higher this past week. My guess is that it will cross under the four-week average soon. My guess is that when this index stops going straight up, the stock market will no longer be going straight up either. Watch for news and commentary from ECRI to understand the implications of a declining index for the economy.

10-year Treasury Bonds were once again the big story this past week. However, prices for the 10-year opened and closed for the week at basically the same price after dipping dramatically and bringing stock prices down, too. My guess is that bond prices may bounce around from here, but it will be a number of weeks before we see new lows for the 10-year. This is only a guess, though.
I heard a lot of discussion about rising yields on the various podcasts that I listened to, but everyone was saying the same thing: that the 10-year yield was rising on inflation expectations. Is it really about inflation? Isn't it possible that there just aren't enough buyers for our bonds because we have lost all discipline when it comes to spending?

As mentioned earlier, one of my favorite areas of the market longer-term is the solars, but they got hit badly this past week. The leaders in this group did decently, but the laggards were hit hard and prices dipped down to their 200-day averages. This chart shows a solid medium-term sell signal for the group, but let's not count these stocks out quite yet.

Does this chart show a gigantic cup-and-handle or a double top? I don't know, but I continue to watch and wait for the next opportunity to make money in the gold miners. Not looking good at the moment, though.

In my opinion, the selling that the market is now experiencing was overdue. We needed to be reminded that stock trading is risky. There was some crazy froth in the market, as seen with GameStop, bitcoin, SPACs, and so on. So with these speculative areas of the market washed out, I'm optimistic and looking forward to owning stocks with good sales, earnings, and healthy balance sheets.
Outlook Summary
- The short-term trend is down for stock prices as of Feb. 18.
- Contrarian sentiment is unfavorable for stock prices as of Nov. 14.
- The economy is in expansion as of Sept. 19.
- The medium-term trend for treasury bonds is down as of Oct. 10 (prices lower, yields higher).


Comments
Log in or sign up to join the conversation.