
Re-visiting Mitt Romney’s “We should be seeing numbers in the 500,000 jobs created per month.” [1]
Well, it’s clear 500,000/month is not the norm. Figure 1 presents employment growth (in logs) relative to trough in the last four recoveries. I have included a trend line implied by the 500,000/mo normalized by nonfarm payroll employment in May 2012 (when Governor Romney made the comment).
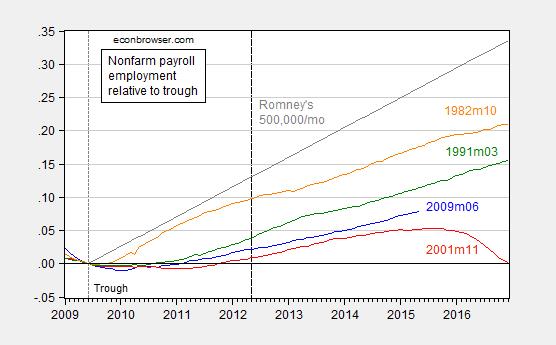
Figure 1: Log nonfarm payroll employment relative to 2009M06 trough (blue), to 2001M11 trough (red), to 1991M03 trough (green), 1982M10 trough (orange). Long dashed line at 2012M05 at the time of Governor Romney’s remarks. Source: BLS, May 2015 release, and author’s calculations.
The interesting point is that one has to go back three decades, and three recoveries, to get any numbers that are close to 500,000.
This leaves open the question of what is the expected pace of job creation. That in turn depends upon at the very minimum on (1) the pace economic activity generally, e.g., GDP growth, and (2) the labor intensity of GDP. Since GDP growth lower in the 1991 and 2001 recoveries than the in the preceding, slower employment growth seems a given, even if the employment/GDP ratio were constant (which it isn’t).
Some people will object that the preceding graph does not condition on the depth of the recession. This point is correct, but not a critique per se. The graph also does not condition on the labor intensity of output, nor any of the other determinants of GDP growth, such as financial crisis, or deleveraging. These points have been highlighted by Reinhart and Rogoff (discussed here).


Comments
Log in or sign up to join the conversation.