

Johns Hopkins has maintained one of the go-to data sites for the global coronavirus pandemic, where their time series data stretches back to January 22, 2020.
Since the data shows weekly 'seasonality', where daily statistics tend to be underreported on weekends, the common trick most analysts have adopted to work around the regular noise that creates in the data is to track the seven day moving average of the daily count of newly confirmed COVID-19 cases and reported deaths. We now have nine months worth of that seven month moving averages, so with coronavirus cases surging in Europe and on the rise in the U.S., we thought it was a good time to focus just on those two regions.
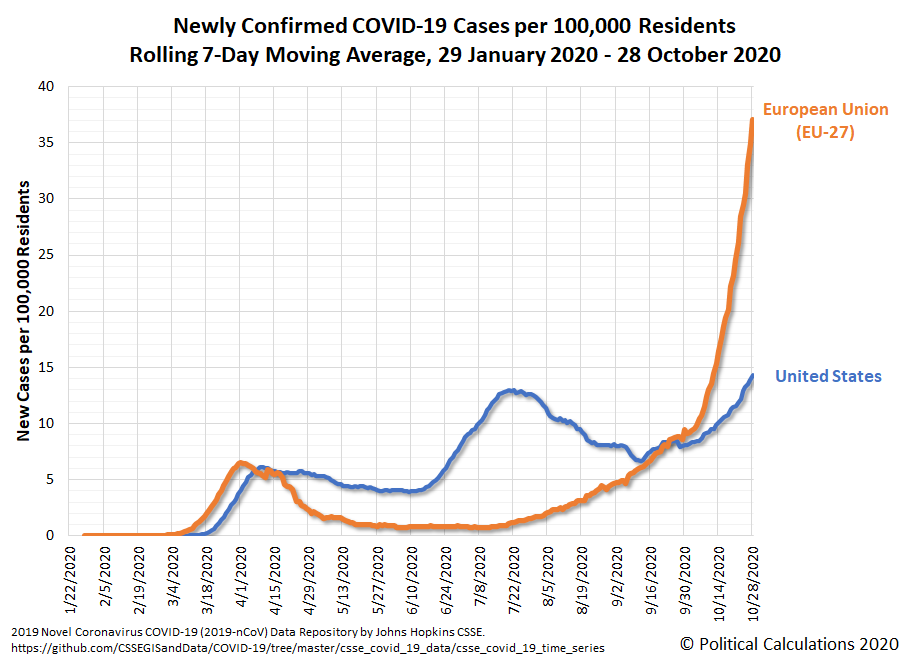
Here's a chart showing the rolling seven day moving averages for the number of newly confirmed COVID-19 cases per 100,000 residents in both the United States and the 27 nations of the European Union. It shows that the EU has become the new global epicenter for the spread of SARS-CoV-2 coronavirus infections, with an average rate of spread among its residents that has skyrocketed to be more than double that in the U.S.
We have a second chart tracking the rolling seven day moving averages for the number of newly reported COVID-19 deaths per 100,000 residents in both the U.S. and the EU-27.
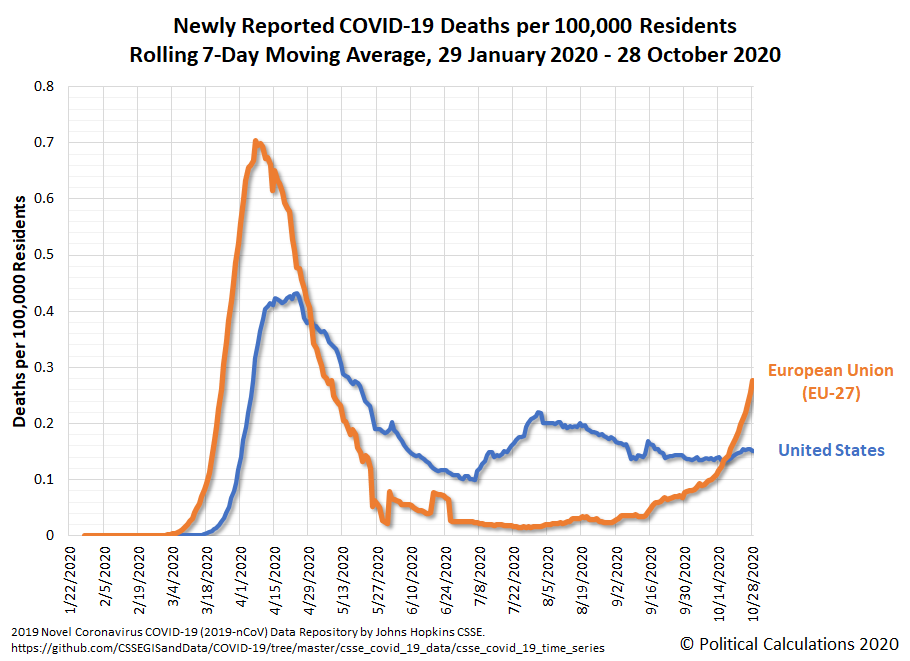
This second chart shows a significant difference in the experience of the EU-27 and the U.S. The rate of deaths in the European Union is rising rapidly, following the basic pattern that the spread of newly confirmed cases has in the region, where it is nearing double the rate occurring in the U.S. as of October 28, 2020. What stands out here however is that the relative rate of COVID-19 deaths in the U.S. has fallen within a relatively narrow range over the last two months, even though the number of cases in the U.S. has been rising over nearly that entire period of time.
This difference between the two regions helps explain why much of Europe is retreating into lockdown mode, despite knowing the economic damage that will be caused by doing so, while the U.S. appears better positioned to weather its latest regional wave of cases.
Most of the U.S.' excess number of COVID-19 deaths can be attributed to just four states that sustained a particularly disastrous policy in the early months of the pandemic.

Comments
Log in or sign up to join the conversation.