

Nikkei Retreats to Test the 68,200 Area Again
And so, this morning we woke up to two very different developments on the Japanese front.
On the one hand, China escalated its economic pressure on Japan, blacklisting four Japanese government defense research institutes and imposing tighter export restrictions on dozens of other Japanese entities. Among those targeted were several units of Mitsubishi Electric (MIELY) and Mitsubishi Heavy Industries, as well as drone maker Terra Drone Corporation and nuclear fuel processors — moves Beijing framed as a response to Japanese Prime Minister Sanae Takaichi's remarks that Tokyo could hypothetically intervene militarily in a crisis over Taiwan.
On the other hand, retail sales surprised decisively to the upside, rising 5.3% YoY versus expectations of +3.2%, highlighting how nominal wage growth — the same factor that initially helped push inflation expectations higher and supported the Bank of Japan's ongoing normalization process — now appears to be translating into a stronger consumer.
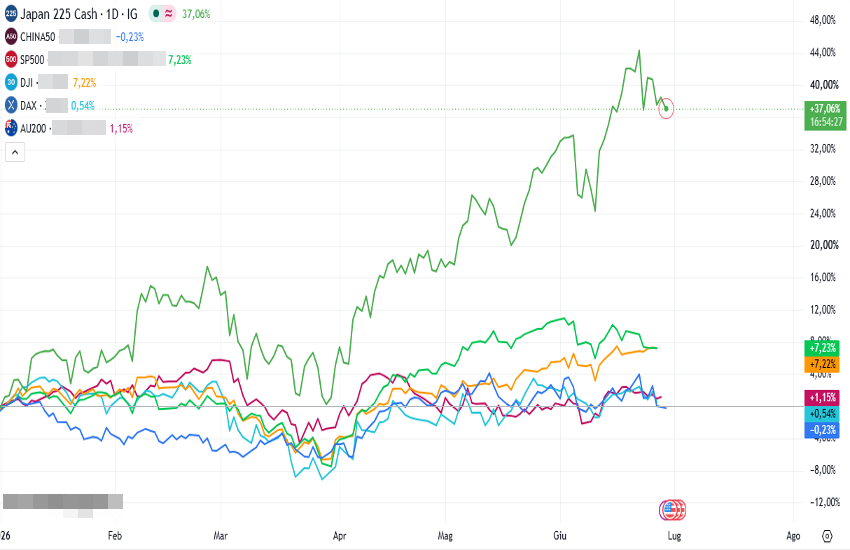
Against this backdrop — with an economy that expanded at an annualized 2.1% rate in Q1 2026, while the central bank continues to shrink its balance sheet and the country's monetary base keeps contracting — the Nikkei remains the best-performing major equity index globally and across Asia. In the chart below, you can see that its annual gain of more than 35% is by far superior not only to US and European indices, but also to geographically closer peers such as Australia and China.
Of course, we have repeatedly noted that the continued depreciation of the JPY (currently at 161.78 and — as we had anticipated — still not subject to intervention and allowed to weaken toward the 162 area) has supported the revaluation of the Nikkei. However, even after adjusting for the USD/JPY closing level of 156.71 on December 31, the Japanese index would be only around 3% lower (equivalent to roughly 67,200 points).
This morning, however, the Nikkei is among the weakest performers in Asia (-0.80% at the time of writing), with only the highly volatile Kospi performing worse.
TECHNICAL ANALYSIS
Already last Friday, the Japanese index had fallen 4.15%, closing the cash session at 69,360, but not before testing what appears to be the key near-term support level around 68,200. This level was tested again overnight (with a low of 68,017) and immediately triggered a rebound back to the current 69,250 area; the 21-day moving average also passes nearby, at around 69,386.
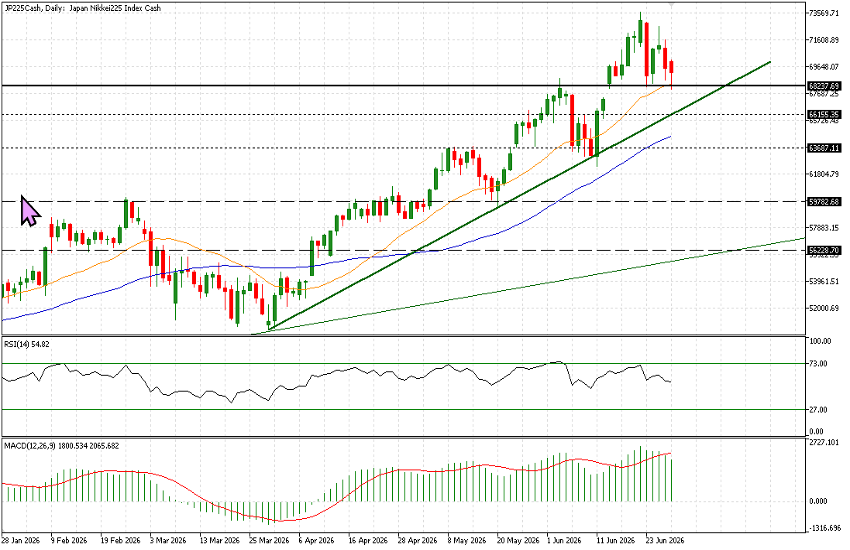
The chart remains clearly bullish. The trendline originating on March 30 currently stands around 66,200 (approximately 4.4% lower), while the 50-day moving average continues to slope upward and remains below the 21-day moving average (currently around 64,500). The technical indicators we typically monitor — RSI and MACD — may not be quite as exuberant as price action itself, but they show no signs of divergence whatsoever.
Therefore, for the time being, our approach is to acknowledge the possibility of pullbacks while treating them as accumulation opportunities, keeping in mind that — aside from the steeper trend that began this spring — the Nikkei should still be considered bullish down to around the 56,000 level.
There are several support levels in between: first 68,200, as already mentioned, then around 66,150 and 63,675. Only if all of these levels were decisively breached would we shift our attention toward the 59,800 area, although it is far too early to consider that scenario. On the upside, the levels to monitor are 70,750, 72,000, and finally the all-time high at 73,630.
In short, if the broader market environment and risk sentiment allow it — and that is a significant caveat — the Nikkei still appears to offer an attractive opportunity: certainly one to let run, and probably one where investors should look for entry points during potential pullbacks.



Comments
Log in or sign up to join the conversation.