

Image Credit: An aerial view of a lot of houses photo by Modunite Ltd on Unsplash.
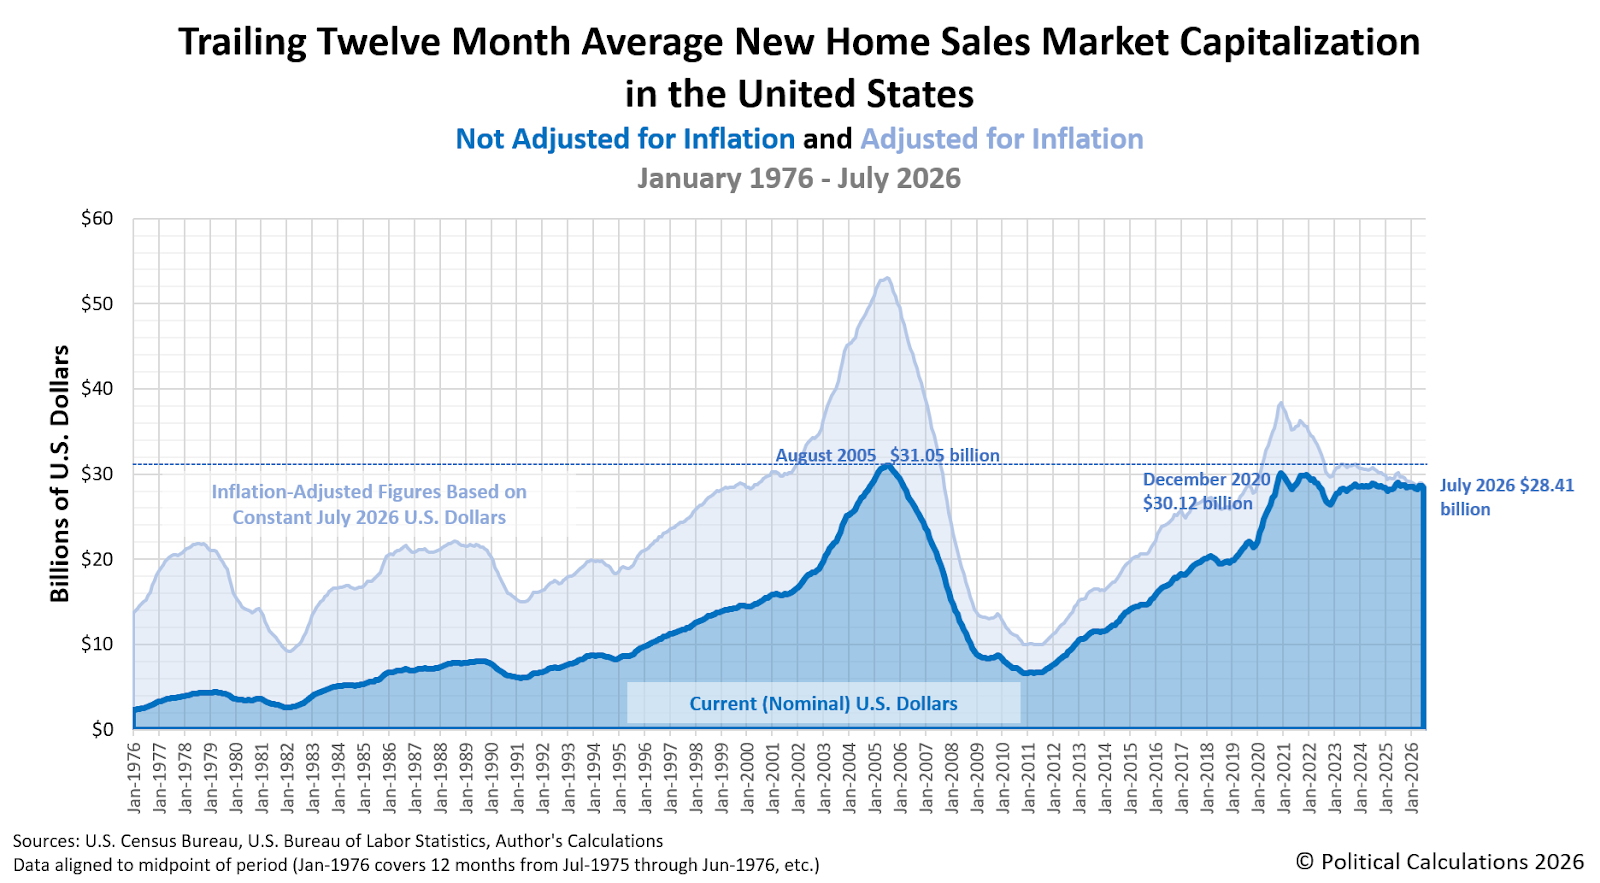
Political Calculations' initial estimate of the total value of new home sales in the United States during July 2026 is $28.41 billion. This value is slightly lower than the initial estimate of $28.62 billion we presented in our previous update that covered new home sales data through May 2026.
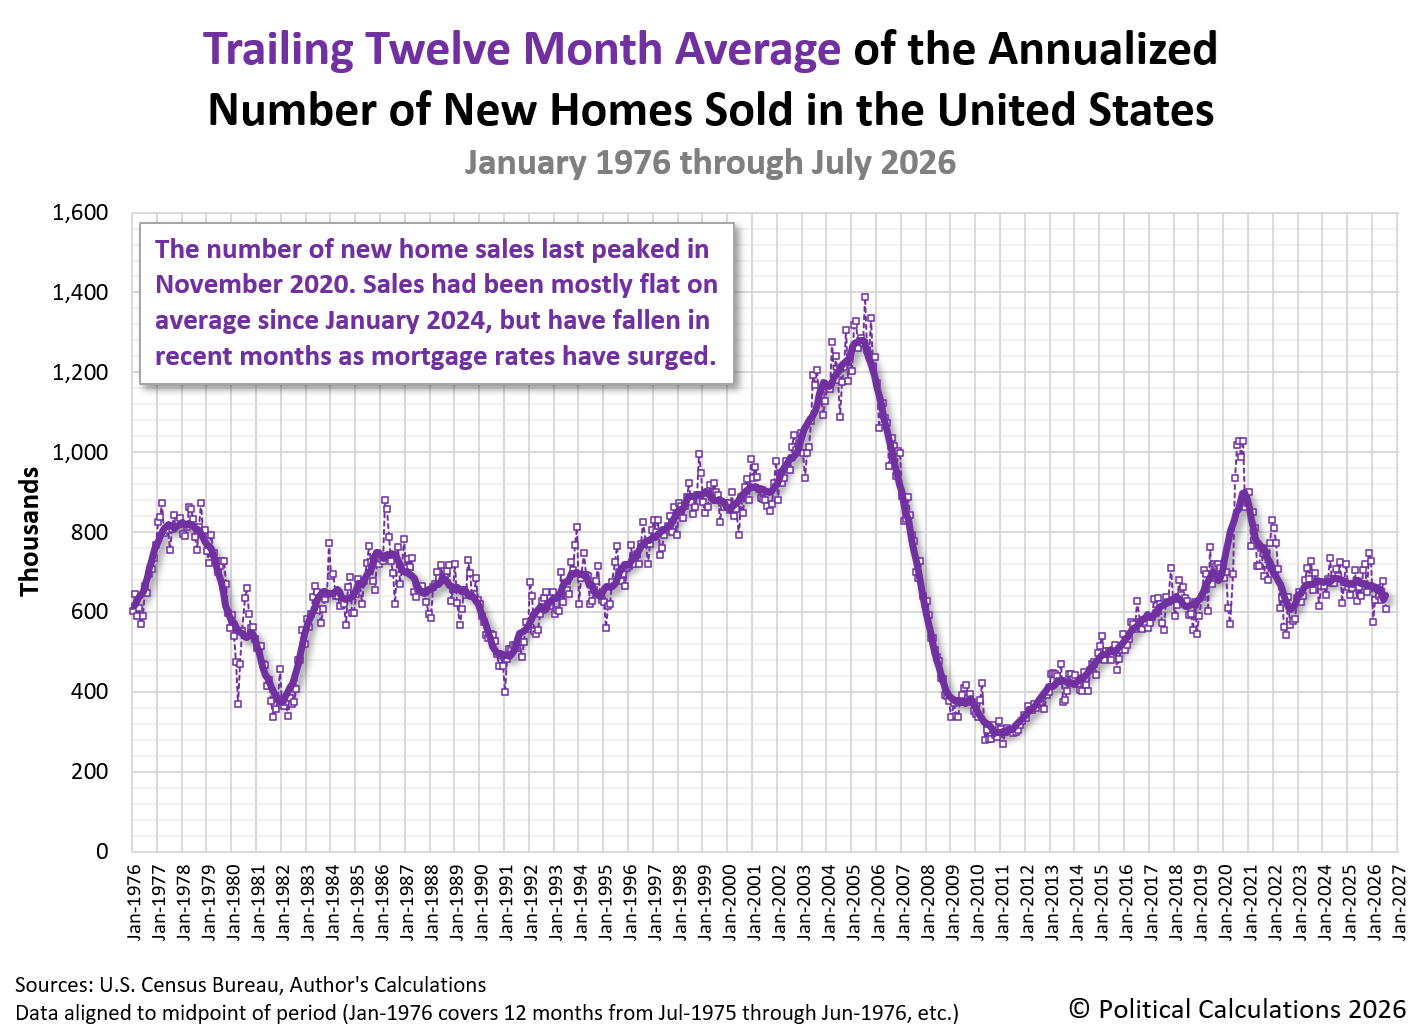
Since then, the number of new home sales has been trending downward thanks largely to an increase in mortgage rates in recent months, which has made new homes relatively less affordable during this time. The number of new home sales has dropped to its lowest level since the start of the year.
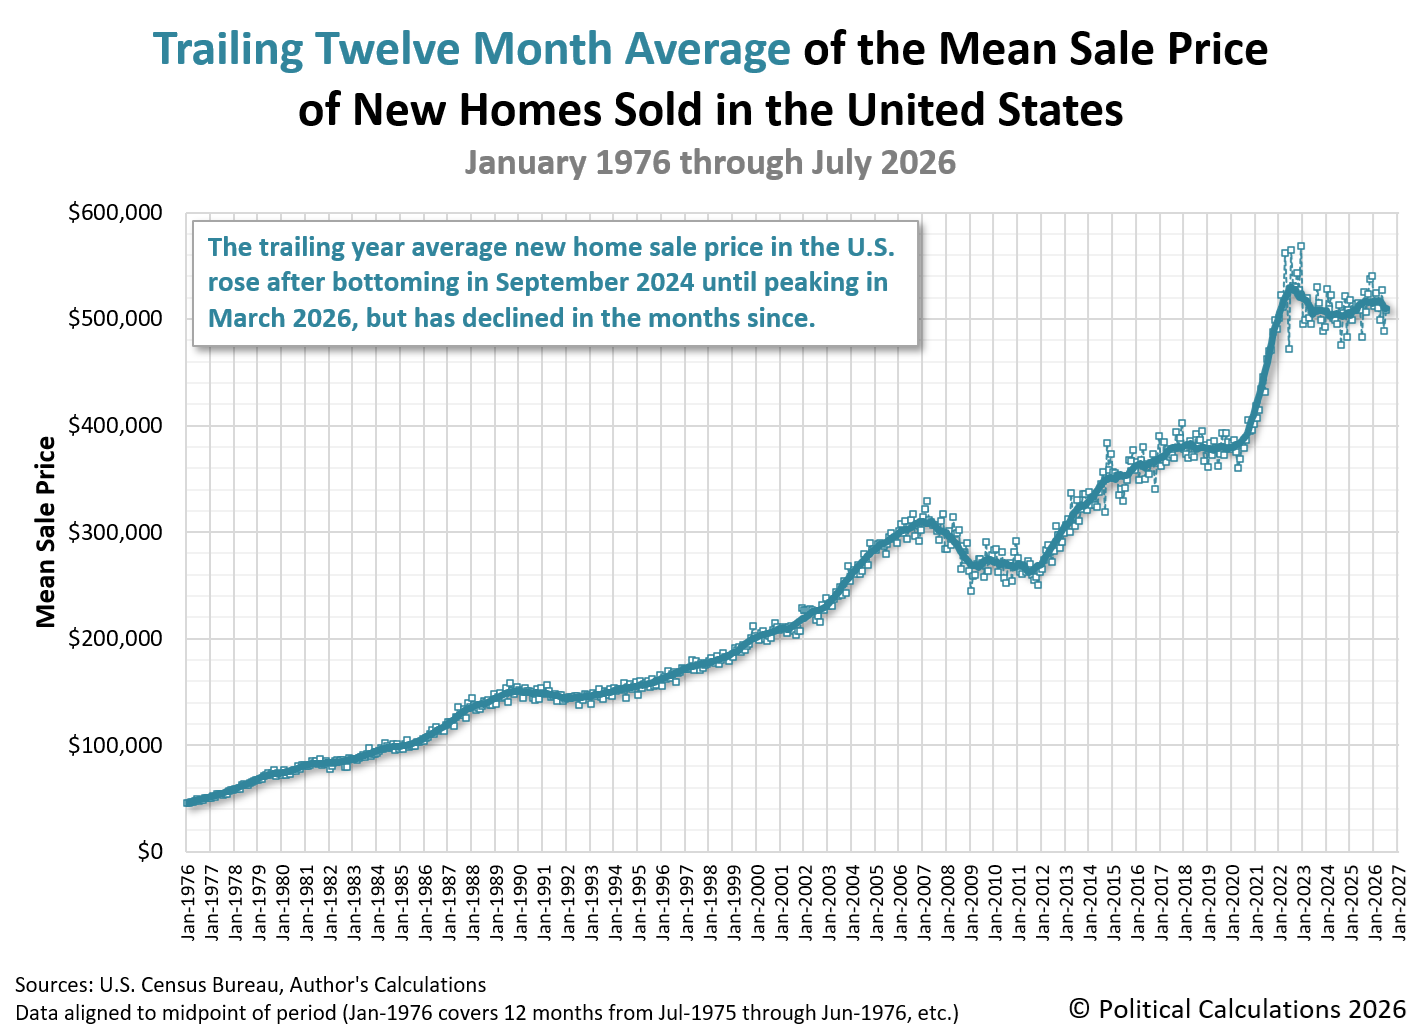
One surprising development however is that the average new home sale prices has also declined in recent months. Builder incentives are making new homes less expensive than existing homes.
As far back as modern records go, newly built homes have almost always cost more than previously owned homes.
It only makes sense: New homes are expected to have far fewer maintenance issues, brand new appliances, and designs suited to contemporary tastes, plus they can be customized to suit the homebuyer's needs.
After all, it is only in very rare circumstances that a used car would cost more than a similar make and model purchased brand new at the dealer's lot.
But in recent months, that trend has been upended to an extent that has never been seen, with the typical new home selling at a sharp discount to existing homes.
In June, the $407,200 median sales price of new homes was about $28,000 less than for existing homes, a 6.5% discount and by far the biggest inversion in at least 25 years.
Last month, the gap narrowed a bit to nearly $19,000, or 4%—still significantly larger than any discount seen before this year. July also marked the fourth straight month of price inversion for new homes, the longest stretch on record.
The following charts present the U.S. new home market capitalization, the number of new home sales, and their average sale prices as measured by their time-shifted, trailing twelve month averages from January 1976 through July 2026.
New home sales trending down:
New home prices also trending down:
We'll update our measure of the relative affordability of new homes sometime in the next week.
References
U.S. Census Bureau. New Residential Sales Historical Data. Houses Sold. [Excel Spreadsheet]. Accessed 25 August 2026.
U.S. Census Bureau. New Residential Sales Historical Data. Median and Average Sale Price of Houses Sold. [Excel Spreadsheet]. Accessed 25 August 2026.


Comments
Log in or sign up to join the conversation.