
A large literature has examined the effects on employment of raising the minimum wage, with different researchers arriving at conflicting conclusions. The core reason that economists can’t answer questions like this better is that we usually can’t run controlled experiments. There is always some reason that the legislators chose to raise the minimum wage, often related to prevailing economic conditions. We can never be sure if changes in employment that followed the legislation were the result of those motivating conditions or the result of the legislation itself. For example, if Congress only raises the minimum wage when the economy is on the rebound and all wages are about to rise anyway, we’d usually observe a rise in employment following a hike in the minimum wage that is not caused by the legislation itself. UCSD Ph.D. candidate Michael Wither and his adviser Professor Jeffrey Clemens have some interesting new research that sheds some more light on this question.
Clemens and Wither study the effects of a series of hikes in the federal minimum wage signed into law in May 2007. The first of these raised the minimum rage from $5.15 to $5.85 effective July 2007, the second from $5.85 to $6.55 effective July 2008, and the third from $6.55 to $7.25 in July 2009. They note that such legislation would be expected to affect some states more than others, since many states already had a state-mandated minimum wage that was higher than the federal. They therefore chose to compare two groups of states, the first of which had a state-mandated minimum wage of $6.55 or higher as of January 2008, with all other states included in the second group. The hope is that this gives us a kind of controlled experient, with the federal legislation effectively raising the minimum wage for some states but not others.
The hike in the federal minimum wage should also matter more for some workers than others. To allow for the latter possibility, Clemens and Wither considered two different groups of workers. The first group had an average wage in the 12 months leading up to July 2009 that was below $7.50, while the second group had an average wage over this period between $7.50 and $10.00. We would expect the legislation to matter more for the first group than for the second. The quasi-experiment is thus to compare the change in wages between low skill and slightly higher skill individuals between states that were affected by the federal legislation and those that were not.
The upper left panel of the figure below summarizes the experience for workers in the first group (an average wage over August 2008 to July 2009 that was below $7.50). The dashed line follows individuals in states that already had a state minimum wage above $6.55 as of January 2008, while the solid line tracks people in states where the raise in the federal minimum wage would have been predicted to have a binding effect. The heights of the lines indicate the fraction of individuals in this group who were employed and earned a wage during the indicated month that was between $5.15 and $7.25. Prior to the hike in the federal minimum wage, this fraction was about 20% in the first group of states and about 40% in the second. After the final hike in the minimum wage, the fraction was about the same for both groups of states. The legislation thus had its intended effects of significantly raising the wage for low-wage individuals in states that did not already have a higher minimum wage.
The upper right panel follows individuals whose average wage over August 2008 to July 2009 was between $7.50 and $10.00, reporting the fraction within that group that earned between $5.15 and $7.25 during the indicated month. These are individuals who at some time before the final minimum wage hike had a much better paying job, but nevertheless took a low-paying job during the particular indicated month. Of course these numbers are much smaller than for the upper left panel. But it was still a little more common for the slightly higher skilled individuals in the low-minimum-wage states to take a job paying below $7.50 prior to the final hike in the federal minimum wage, with this small difference between states again disappearing after the final federal hike.
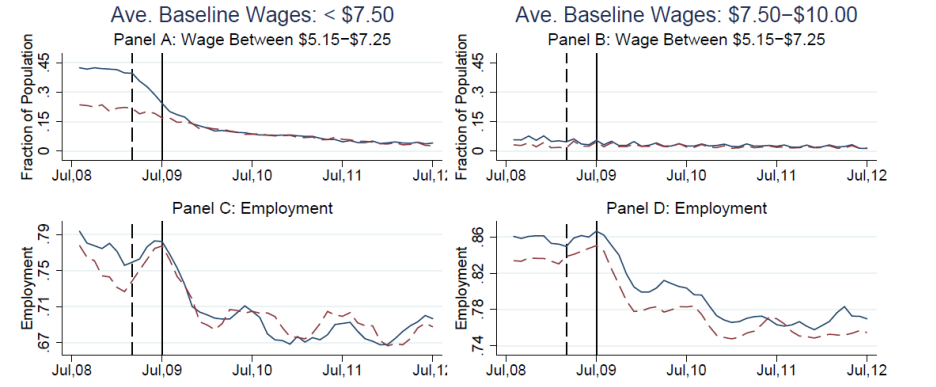
Left column: individuals whose average wage between August 2008 and July 2009 was less than $7.50. Right column: individuals whose average wage was between $7.50 and $10.00. Dashed lines: states whose minimum wage as of January 2008 was $6.55 or higher. Solid lines: other states. Top row: fraction of individuals within the indicated category who earned a wage during the indicated month that was between $5.15 and $7.25. Bottom row: fraction of individuals within the indicated category who were employed in the indicated month. Source: Clemens and Wither (2014).
The second row of the figure summarizes the fraction of each group that were employed in each of the indicated months. Low-wage individuals were more likely to be employed in any given month in the low-minimum-wage states before the rise in the federal minimum wage, but this difference disappeared after the final hike in the federal minimum wage. By contrast, one doesn’t see much difference in the employment experience of slightly higher-wage individuals across the two groups of states as the federal minimum wage changes.
Clemens and Wither examined these differences using a number of statistical approaches. The figure below focuses on the group of low-wage individuals, that is, people whose average earnings over August 2008 to July 2009 was below $7.50. The green x’s come from a regression that tried to predict whether an individual in that group would have earned a wage between $5.15 and $7.25 in any given month. The regression includes state fixed effects (the average experience of people in each state may be different), time fixed effects (the average national experience might be different in each month), individual fixed effects (the average experience of individual i might be different), a measure of house prices in state s in month t, and the possibility of a different average experience for each month in states that had a lower state minimum wage in January 2008 compared to others. The green x’s plot the values for the last group of coefficients for each month, and again show the expected result– the hike in the federal minimum wage successfully lowered the fraction of low-skilled workers who earned a wage below $7.50, as measured by the observed difference between states affected by the federal minimum wage hike and those that were not.
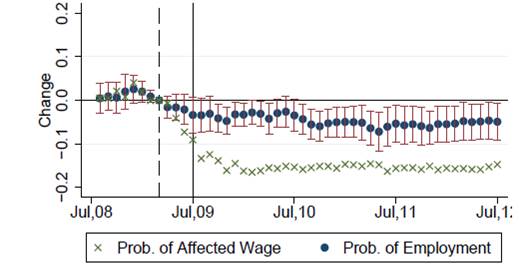
Dynamic estimates of the effects of minimum wage on low-skilled workers. Green x’s denote difference in probability of having a low-wage job between states with low minimum wages and those with high minimum wages. Blue dots indicate difference in probability of being employed between states with low minimum wages and those with high minimum wages, with accompanying 95% confidence intervals. Source: Clemens and Wither (2014).
The blue dots represent the results from a comparable regression to predict whether one of these low-skill individuals had a job. Clemens and Wither found that the federal minimum wage hike resulted in about a 6% decrease in the probability that low-wage individuals would have a job based on this comparison of states in which the minimum wage hike would have been binding and those for which it would not.
The hike in the minimum wage thus appears to have raised the wage for low-skilled workers but made it harder for them to find jobs. Clemens and Wither conclude:
Over the late 2000s, the average effective minimum wage rose by 30 percent across the United States. We estimate that these minimum wage increases reduced the national employment-to-population ratio by 0.7 percentage point.
Comments
Log in or sign up to join the conversation.