
After surging off the December lows, Netflix (NFLX) has done its best impression of a show buffering with a slow internet connection – the stock has gone nowhere. As shown in the highlighted area, the stock has been trading in an extremely tight range relative to its normal trading pattern. Maybe the stock is just consolidating after its big move, or perhaps investors have been taking a wait and see approach ahead of Apple’s streaming announcement late last month and Disney’s (DIS) Investor Day on Thursday (4/11) where the company is slated to unveil its streaming plans.
(Click on image to enlarge)
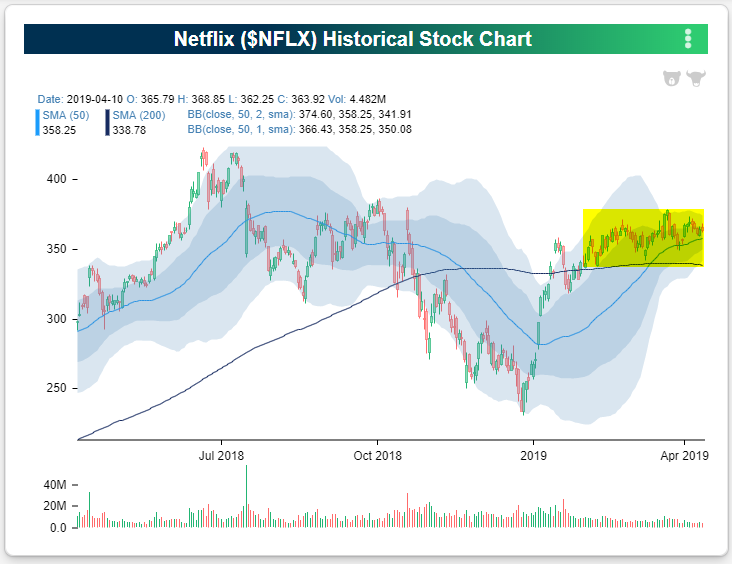
Whatever the cause of the pause, Netflix’s range over the last 50-trading days is near historic lows. With a high/low range (based on closing prices) of 11.3%, the stock’s trading range over the last 50 trading days is just one-quarter of its historical average and narrower than every other period in the stock’s history except two.
(Click on image to enlarge)
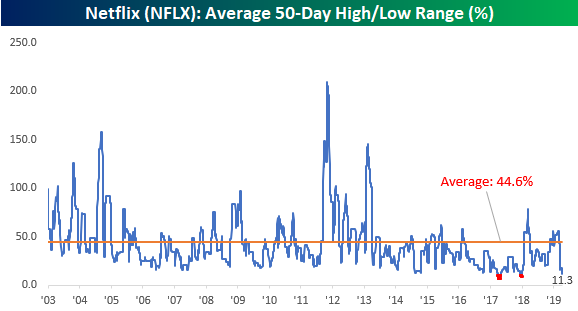
Those two periods where the stock traded in a narrower range were in early and late 2017 when the 50-day range briefly dropped below 10%.In the chart below, we show where those two prior periods occurred with respect to Netflix’s stock price since the start of 2016. For what it’s worth, in both periods where the stock finally moved out of that narrow range, the move was to the upside.
(Click on image to enlarge)


Comments
Log in or sign up to join the conversation.