
Natural gas appears to be in the middle of a corrective pullback after failing to sustain gains past the 0.618 Fibonacci extension level at $3.256.
Price had surged from the swing low at $2.990 to a recent peak just above $3.256, but has since retreated and is currently trading around $3.052, drawing closer to the ascending trend line that’s been guiding the climb since late April.
The Fibonacci extension tool maps out the upside targets from the prior swing move. The 0.382 extension sits at $3.154, the 0.5 at $3.205, and the 0.618 at $3.256. A larger corrective wave could extend back toward the swing low baseline at $2.990, which aligns with the rising trend line and could serve as a line in the sand for bulls.
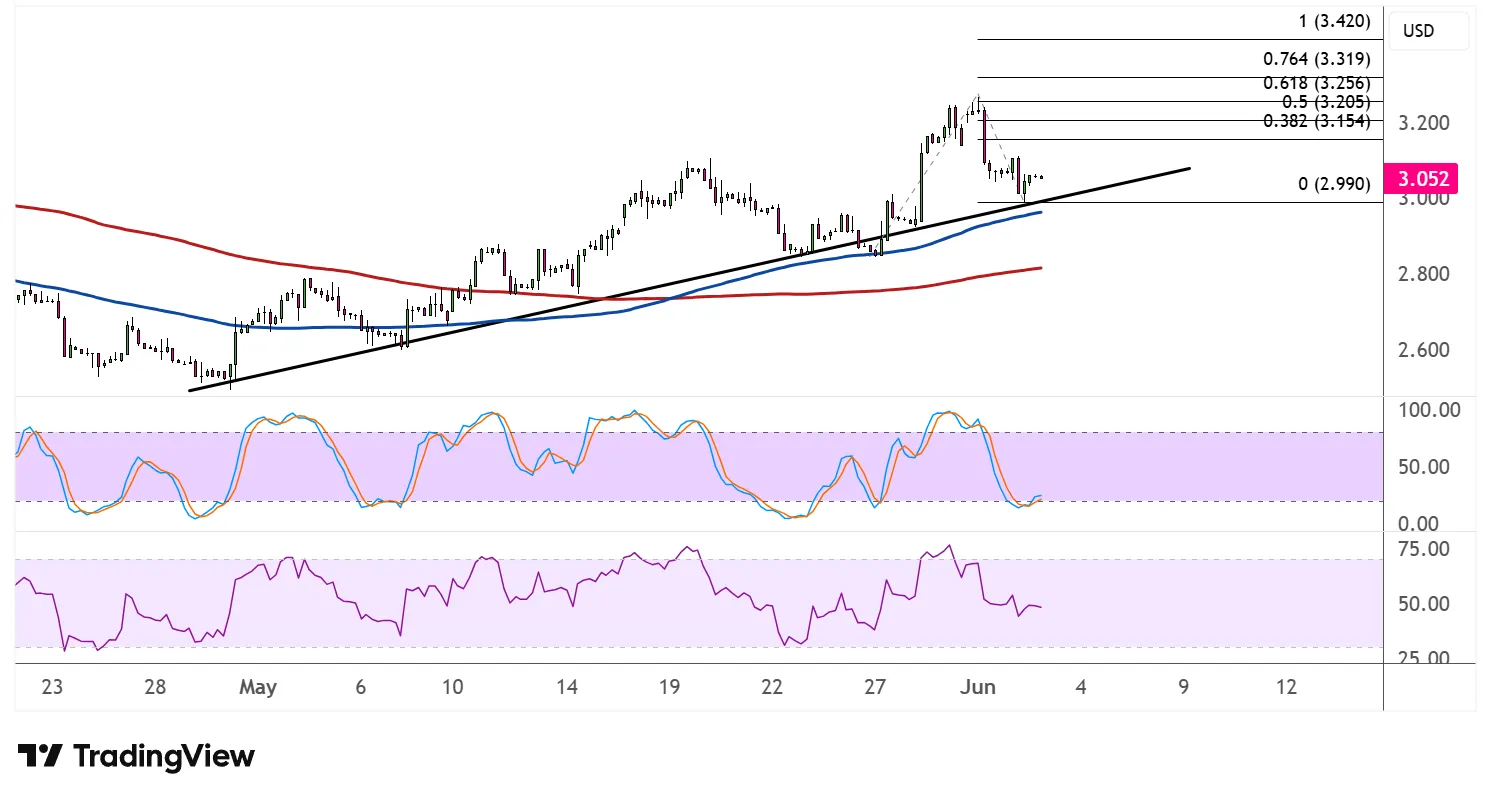
The 100 SMA has crossed above the 200 SMA to confirm that the path of least resistance is to the upside, or that the broader climb is more likely to gain traction than reverse. Price is currently pulling back toward both moving averages, which could act as dynamic support on a dip and attract fresh buying interest.
Stochastic has tumbled sharply from the overbought area and is now hovering just above the oversold zone, suggesting that bearish pressure is nearly exhausted. A crossover to the upside from this region would signal a potential return in bullish momentum.
RSI has similarly pulled back from elevated levels and is approaching the midline, leaving room for a recovery bounce before reaching oversold territory.
If the trend line and moving average support hold, natural gas could make another attempt at the 0.764 extension at $3.319, followed by the full extension target at $3.420.
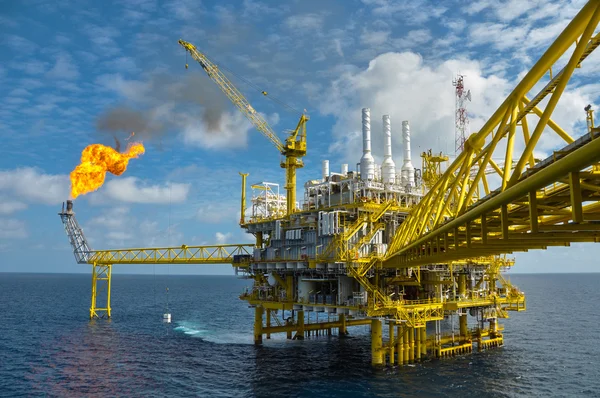
Natural gas appears to have found support from resurfacing geopolitical tensions and doubts about the US-Iran negotiations, as an extension of the conflict could mean more supply risks to the energy market while the Strait of Hormuz remains blocked.
Comments
Log in or sign up to join the conversation.