

Natural gas appears to be carving out an inverted head and shoulders pattern on the short-term time frame, hinting that a bullish reversal from the broader downtrend could be in the works.
The formation features a left shoulder near the $2.750 area, a deeper head around the $2.500 lows, and a right shoulder currently consolidating just below the neckline resistance around the $2.750–$2.800 zone.
A decisive break and close above the neckline could confirm the reversal, opening the door to an upside move roughly equal in height to the pattern. This would project potential gains toward the $3.000 psychological level or the area around the 200 SMA dynamic resistance, which has been sloping steadily lower and could serve as the next ceiling.
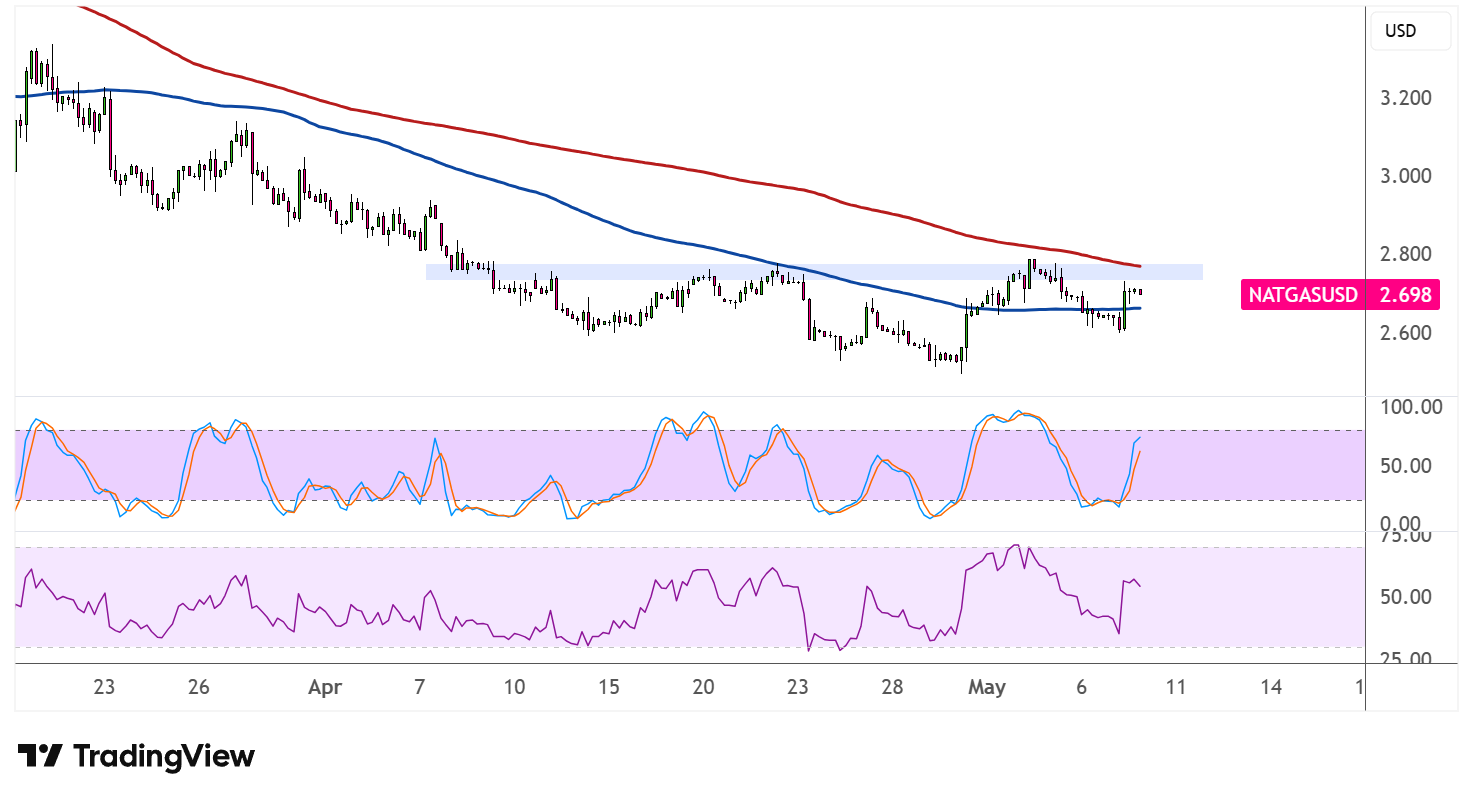
However, the moving averages continue to paint a cautious picture. The 100 SMA remains below the 200 SMA to suggest that the path of least resistance is still to the downside, meaning that sellers could regain control before a sustained breakout takes hold. Both indicators are also positioned above current price, reinforcing their role as dynamic resistance on any climb.
On the oscillators, stochastic is turning sharply higher from the oversold region, reflecting a return in bullish momentum that could give natural gas the push it needs to test the neckline. RSI, meanwhile, is also trending higher but has ample room to run before reaching overbought territory, suggesting that buyers could maintain the upper hand in the near term.
A failure to clear the neckline, on the other hand, could see price slip back toward the $2.600 support or revisit the pattern lows near $2.500. Inventory data and broader risk sentiment are likely to influence which scenario plays out, as hopes of de-escalation between the US and Iran could continue to dampen supply risks.

Comments
Log in or sign up to join the conversation.