

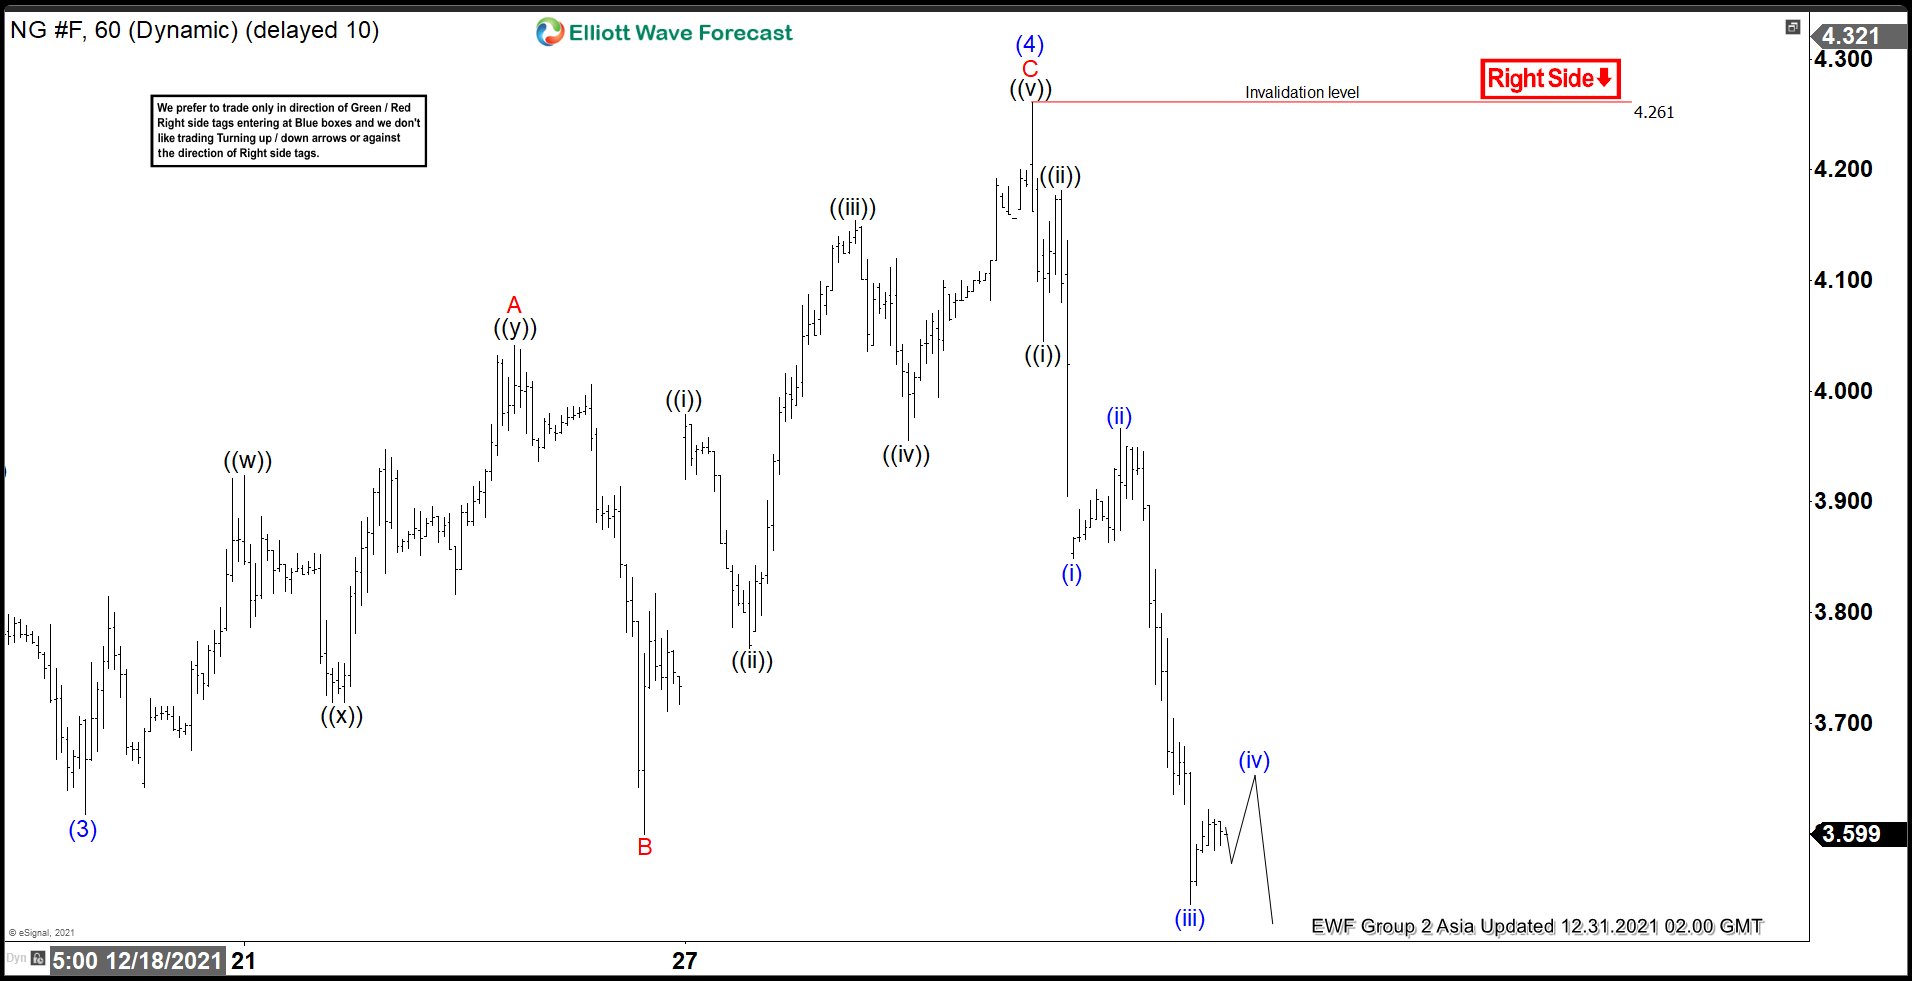
Elliott Wave View in Natural Gas (NG) suggests it is correcting cycle from June 22, 2020 low in larger degree 3, 7, or 11 swing. The decline is unfolding as a flat elliott wave structure. Down from October 6, 2021 peak (6.47), wave ((A)) ended at 4.825 and rally in wave ((B)) ended at 6.291. Wave ((C)) lower is in progress as a 5 waves impulse. The 1 hour chart below shows wave (3) of ((C)) ended at 3.617. Wave (4) of ((C)) bounce ended at 4.261 as an expanded flat structure.
Photo by American Public Power Association on Unsplash
Up from wave (3), wave A ended at 4.041, and a pullback in wave B ended at 3.599. Wave C higher ended at 4.261 which also completed wave (4). The commodity has extended lower in wave (5) with internal subdivision as an impulse. Down from wave (4), wave ((i)) ended at 4.045 and wave ((ii)) ended at 4.181. Near term, expect a rally to fail in 3, 7, or 11 swing as far as pivot at 4.261 high stays intact for further downside. Once the 5 waves down from wave (4) high are complete, it could either complete wave 1 of (5), or it could end the entire wave (5).
Natural Gas 1 Hour Elliott Wave Chart
(Click on image to enlarge)



Comments
Log in or sign up to join the conversation.