


The sharp rally off of the March 30th low has seen the Nasdaq climb 25.9%. Back at the time of the low, the Nasdaq was extremely oversold, trading 2.85 standard deviations below its 50-DMA. In percentage terms, the Nasdaq was down 8.4% below that same moving average, which was a lot, but far from any sort of record setting reading.
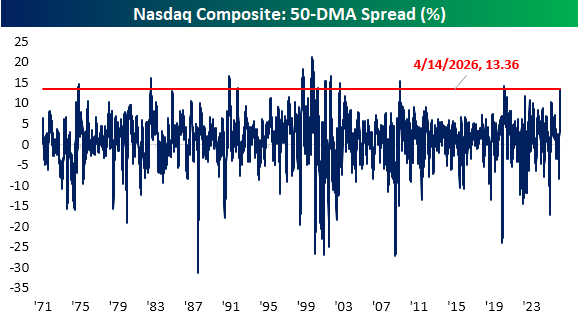
Fast forward to yesterday's close, the opposite was true. While the index wasn't even extremely overbought (only 1.9 standard deviations above its 50-DMA), it did finish 13.4% above its 50-DMA for the most extended reading since June 2020. Going back throughout the over 50 years of history of the index, such extreme readings in the 50-DMA spread have been uncommon. Prior to the 2020 instance, the only other times it traded as far above its moving average was in 2009, various points in the 1990s to the Dot Com bubble burst in the early 2000s, 1982, and 1975.
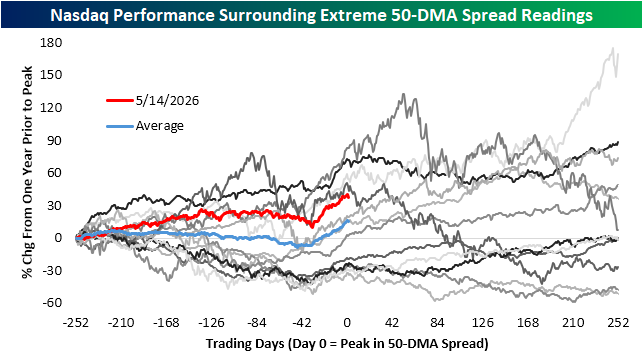
In the chart below, we show how the Nasdaq performed in the one year before and after those historic peaks in the 50-DMA spread. For each line below, day 0 indicates the peak reading in the 50-DMA spread. As shown, of the dozen previous periods, the Nasdaq has been higher versus one year prior seven of the times. This latest rally ranks as the fifth largest of those at 40%. Only the 1992, 1999, and 2000 instances saw bigger gains. Of those periods with larger gains, the following year only saw the index higher twice (up 9.5% after the 1992 instance and 75% after the January 1999 instance) whereas the others were more immediately leading up to the early 2000 Dot Com peak.


Comments
Log in or sign up to join the conversation.