
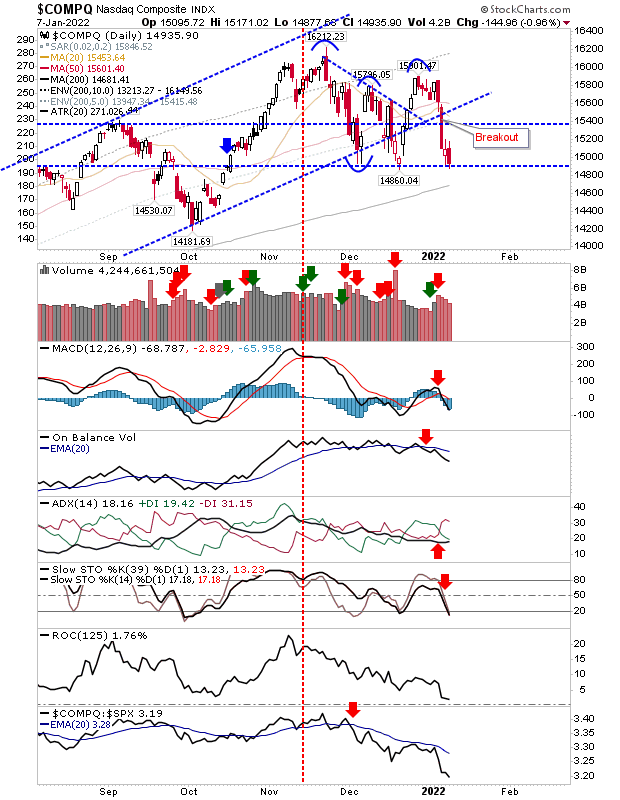
Well, the Nasdaq wasn't able to break through the 16,000 resistance level, and it's now looking to cut below the 14,900 support. The 200-day MA is nearby at 14,681, and it is looking more likely that it will test support than maintain current levels.
Not surprisingly, there was an acceleration in the relative loss of the Nasdaq to the S&P with technicals net bearish. Volume is a balance between sellers and buyers, and the likelihood is that we have a trading range in development.
The S&P 500 drifted below breakout support of 4,710, with the next support level being at the rising channel. Near-term technicals are bearish, but momentum is still holding above the bullish mid-line. The index is outperforming the Russell 2000, which is not great news for bulls in the long run.

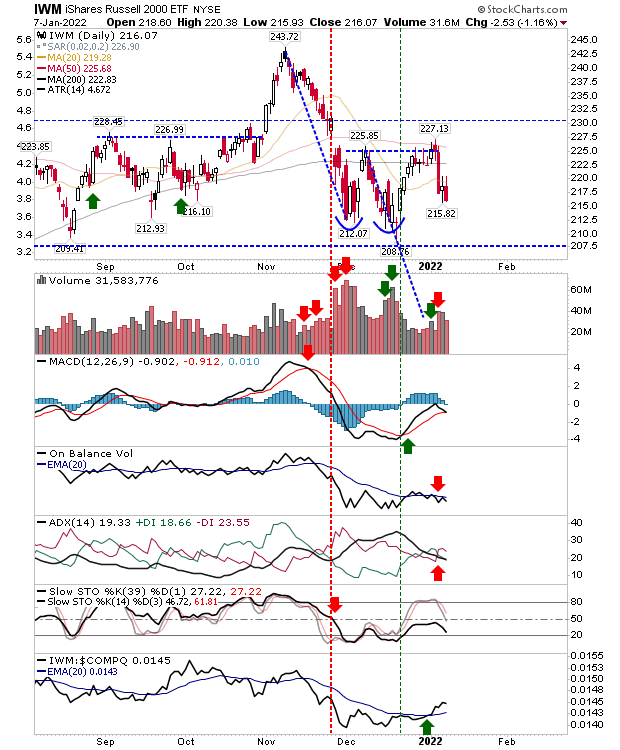
The Russell 2000 had already failed in its attempt to clear the double-bottom neckline resistance, and it now finds itself heading back to support of the double bottom. Technicals are mixed, as we have a MACD trigger 'buy' but bearish technicals elsewhere. We also have an outperformance against the Nasdaq, which means it's not without opportunity.
If there is a chart to watch over the coming weeks, it's this combination of breadth metrics for the Nasdaq. The Percentage of Nasdaq Stocks above the 50-day MA has already reached oversold territory. The Percentage of Nasdaq Stocks above the 200-day MA is close to oversold.
The Nasdaq Bullish Percents still has room to run before becoming oversold. The Summation Index is also close to oversold. If it gets below -800, it will have reached a level typical of major swing lows.
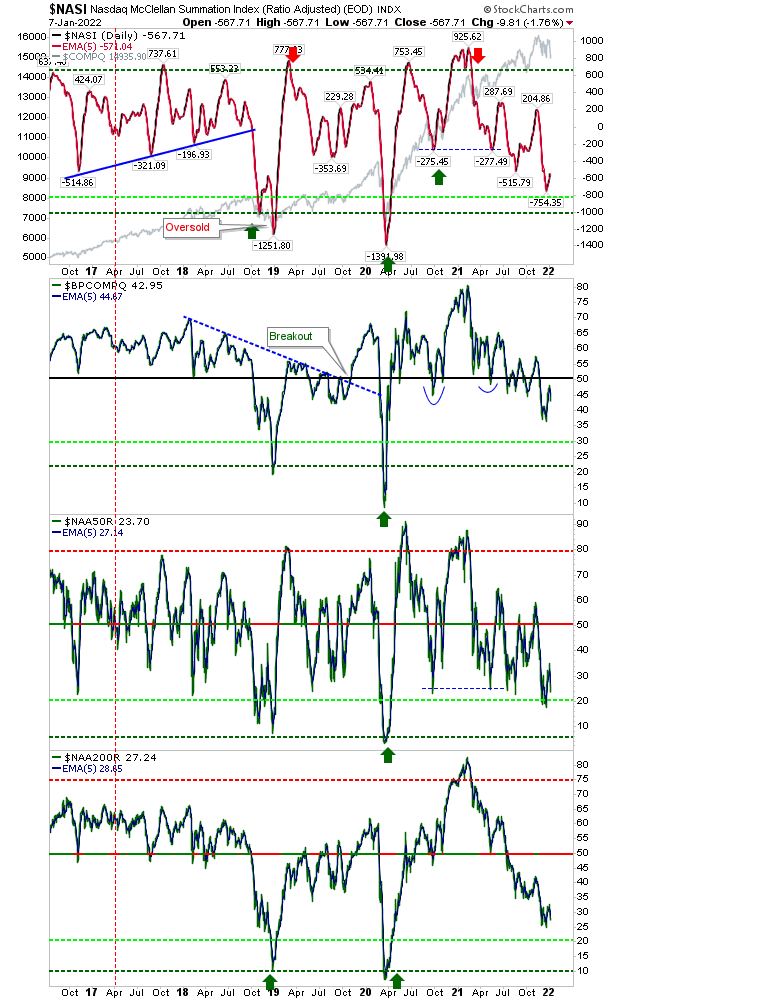
For the coming week, we need to see how support holds - particularly for the Nasdaq - and see how this changes supporting breadth metrics, which will help mark a swing low.


Comments
Log in or sign up to join the conversation.