
- The time to buy stocks is when there is “blood in the streets”.
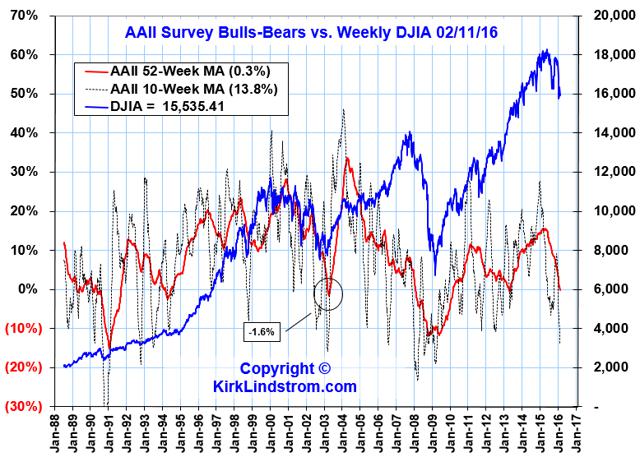
- In late August through early September 2015, my sentiment charts were screaming BUY.
- That was a great time to buy for a tradable rally.
- I took profits as the markets rallied through the end of 2015 and sentiment rose.
- Many sentiment indicators are now close to the lows of last year
Currently, on an intraday basis the S&P500 is down 14.4% from its record high.
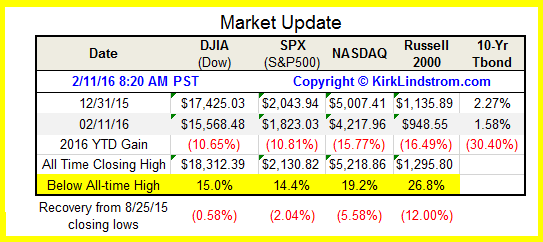
Note how the Russell 2000 small cap index is in a bear market, down 27% from its all-time high and 12% below its 8/25/15 low.
Every week I review my sentiment charts of the weekly data. In this article, I compare the sentiment levels from various surveys in my table to get an idea of overall investor sentiment.
See all the charts and sentiment indicators at
Continue reading this article here.
Comments
Log in or sign up to join the conversation.