
Today the ten year US Treasury note closed above a 6-year resistance line. The next level of resistance is the dashed black line on chart 1 that is currently at about 3.75%. Chart 2 below shows this 28-year trend of the 10-year Treasury bond yield dashed black resistance line has been in effect for 28-years.
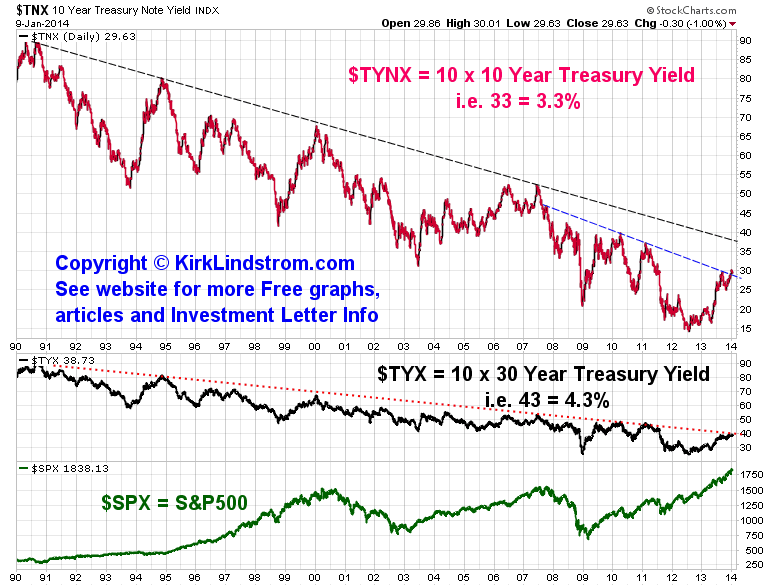
Chart 2: Commentary from Chart of the Day:
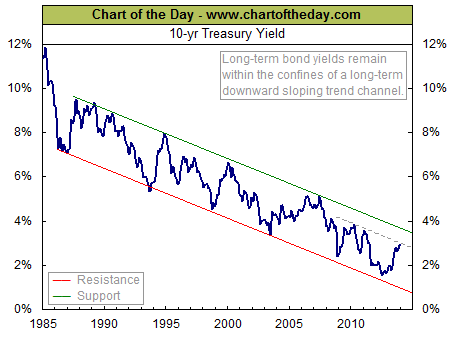
For some perspective on all-important long-term interest rates, today's chart illustrates the 28-year trend of the 10-year Treasury bond yield (thick blue line). As today's chart illustrates, the 10-year Treasury bond yield has moved within the confines of a 27-year downward sloping trend channel. More recently, a modest but improved economic outlook in the US has helped send the 10-year Treasury bond yield higher over the past 18 months. In fact, the 10-year yield has increased a very significant 140 basis points (i.e. 1.4%) since its resistance testing, July 2012 trough. In the end, this upward move in long-term yields is something to watch in light of the US economy's ever increasing dependence on debt.
Comments
Log in or sign up to join the conversation.