

The table below provides a summary of mutual fund flows through the latest reporting period last week showing actual flows on the left and how those flows rank relative to history on the right. With the broader market breaking out of its range to new all-time highs, you would expect flows into mutual funds to be surging, and while there has been a surge in mutual fund flows, the direction has been out of as opposed to into stocks.
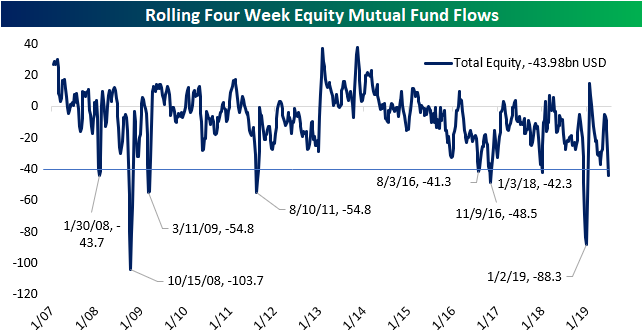
In the latest week, equity mutual funds saw nearly $17 billion in outflows bringing the four-week total of outflows to just under $44 bln. On a percentile basis, those total outflows rank below the 2nd percentile relative to all prior one-week periods in the last decade and below the 3rd percentile relative to all other four-week periods. Not only has there been an exodus out of equity mutual funds, but the declines have been broad-based. across Domestic in Global funds.
(Click on image to enlarge)

Again, the fact that outflows have been so large recently just as the S&P 500 is hitting new all-time highs is unique, to say the least. The chart below shows the rolling four-week total of fund flows going back to the start of 2007. During that time, there have only been eight other periods where the magnitude of outflows from equity mutual funds has been more than $40 billion (as it is now). If you look at the dates of each of those occurrences, more often than not they were during periods of elevated volatility during a market decline rather than in unison with an all-time high in the equity market.
(Click on image to enlarge)



Comments
Log in or sign up to join the conversation.