

Strip away everything you can. Get rid of the trendlines. Remove the retracement patterns. Delete the tints. Even get rid of the price data itself! Just leave in place a trio of exponential moving averages: 50, 100, and 200. Draw your own conclusions. I’ve certainly drawn mine.
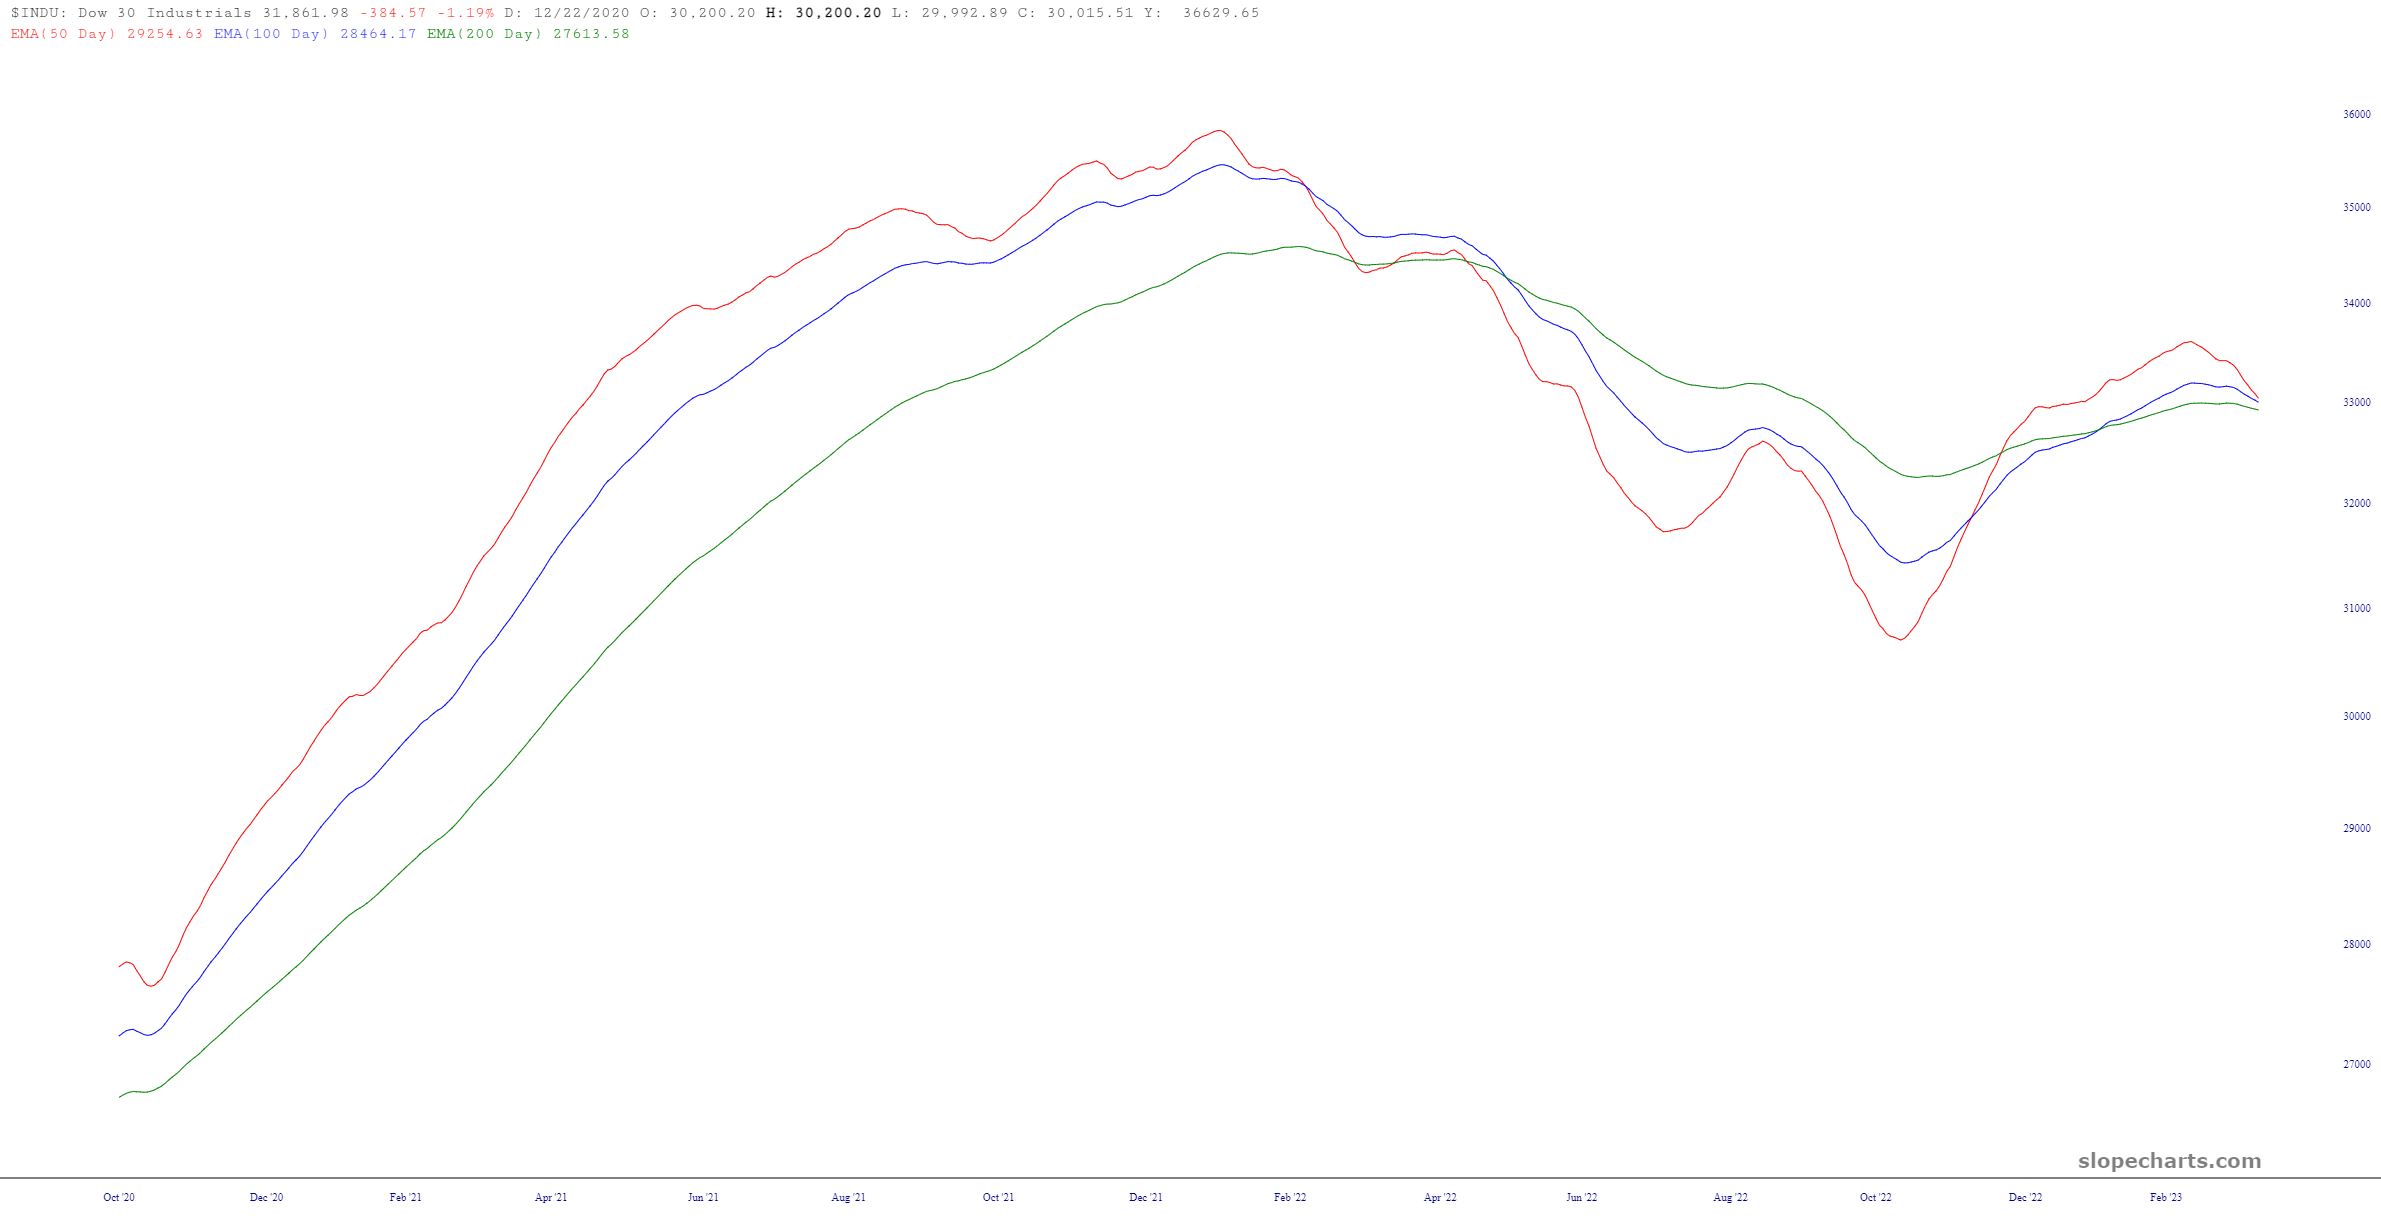
Dow Industrials
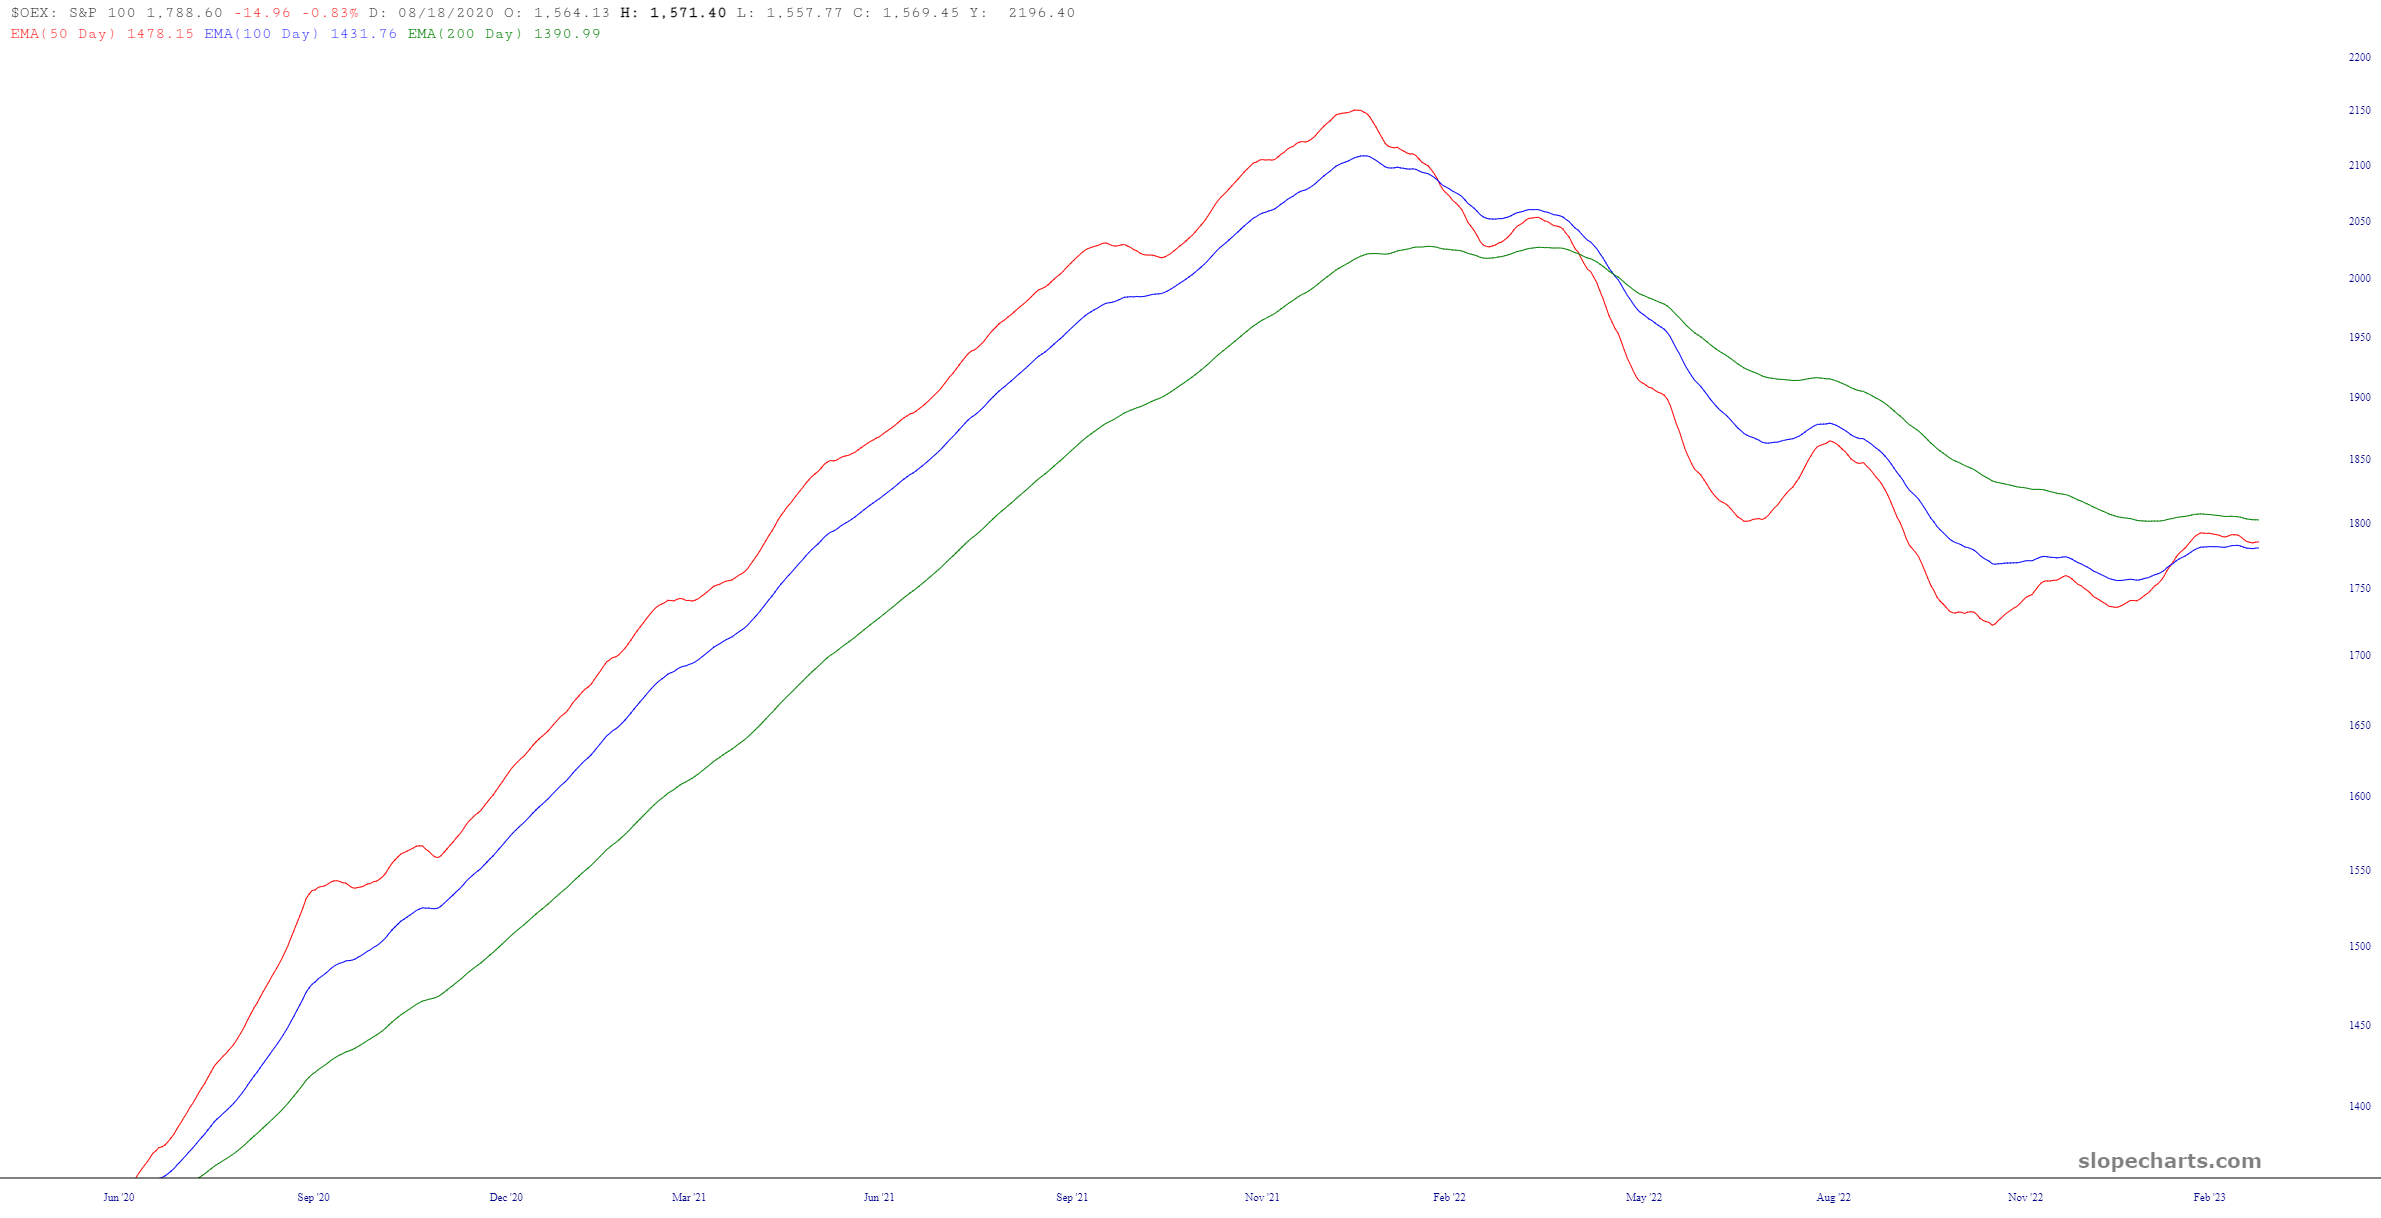
S&P 100
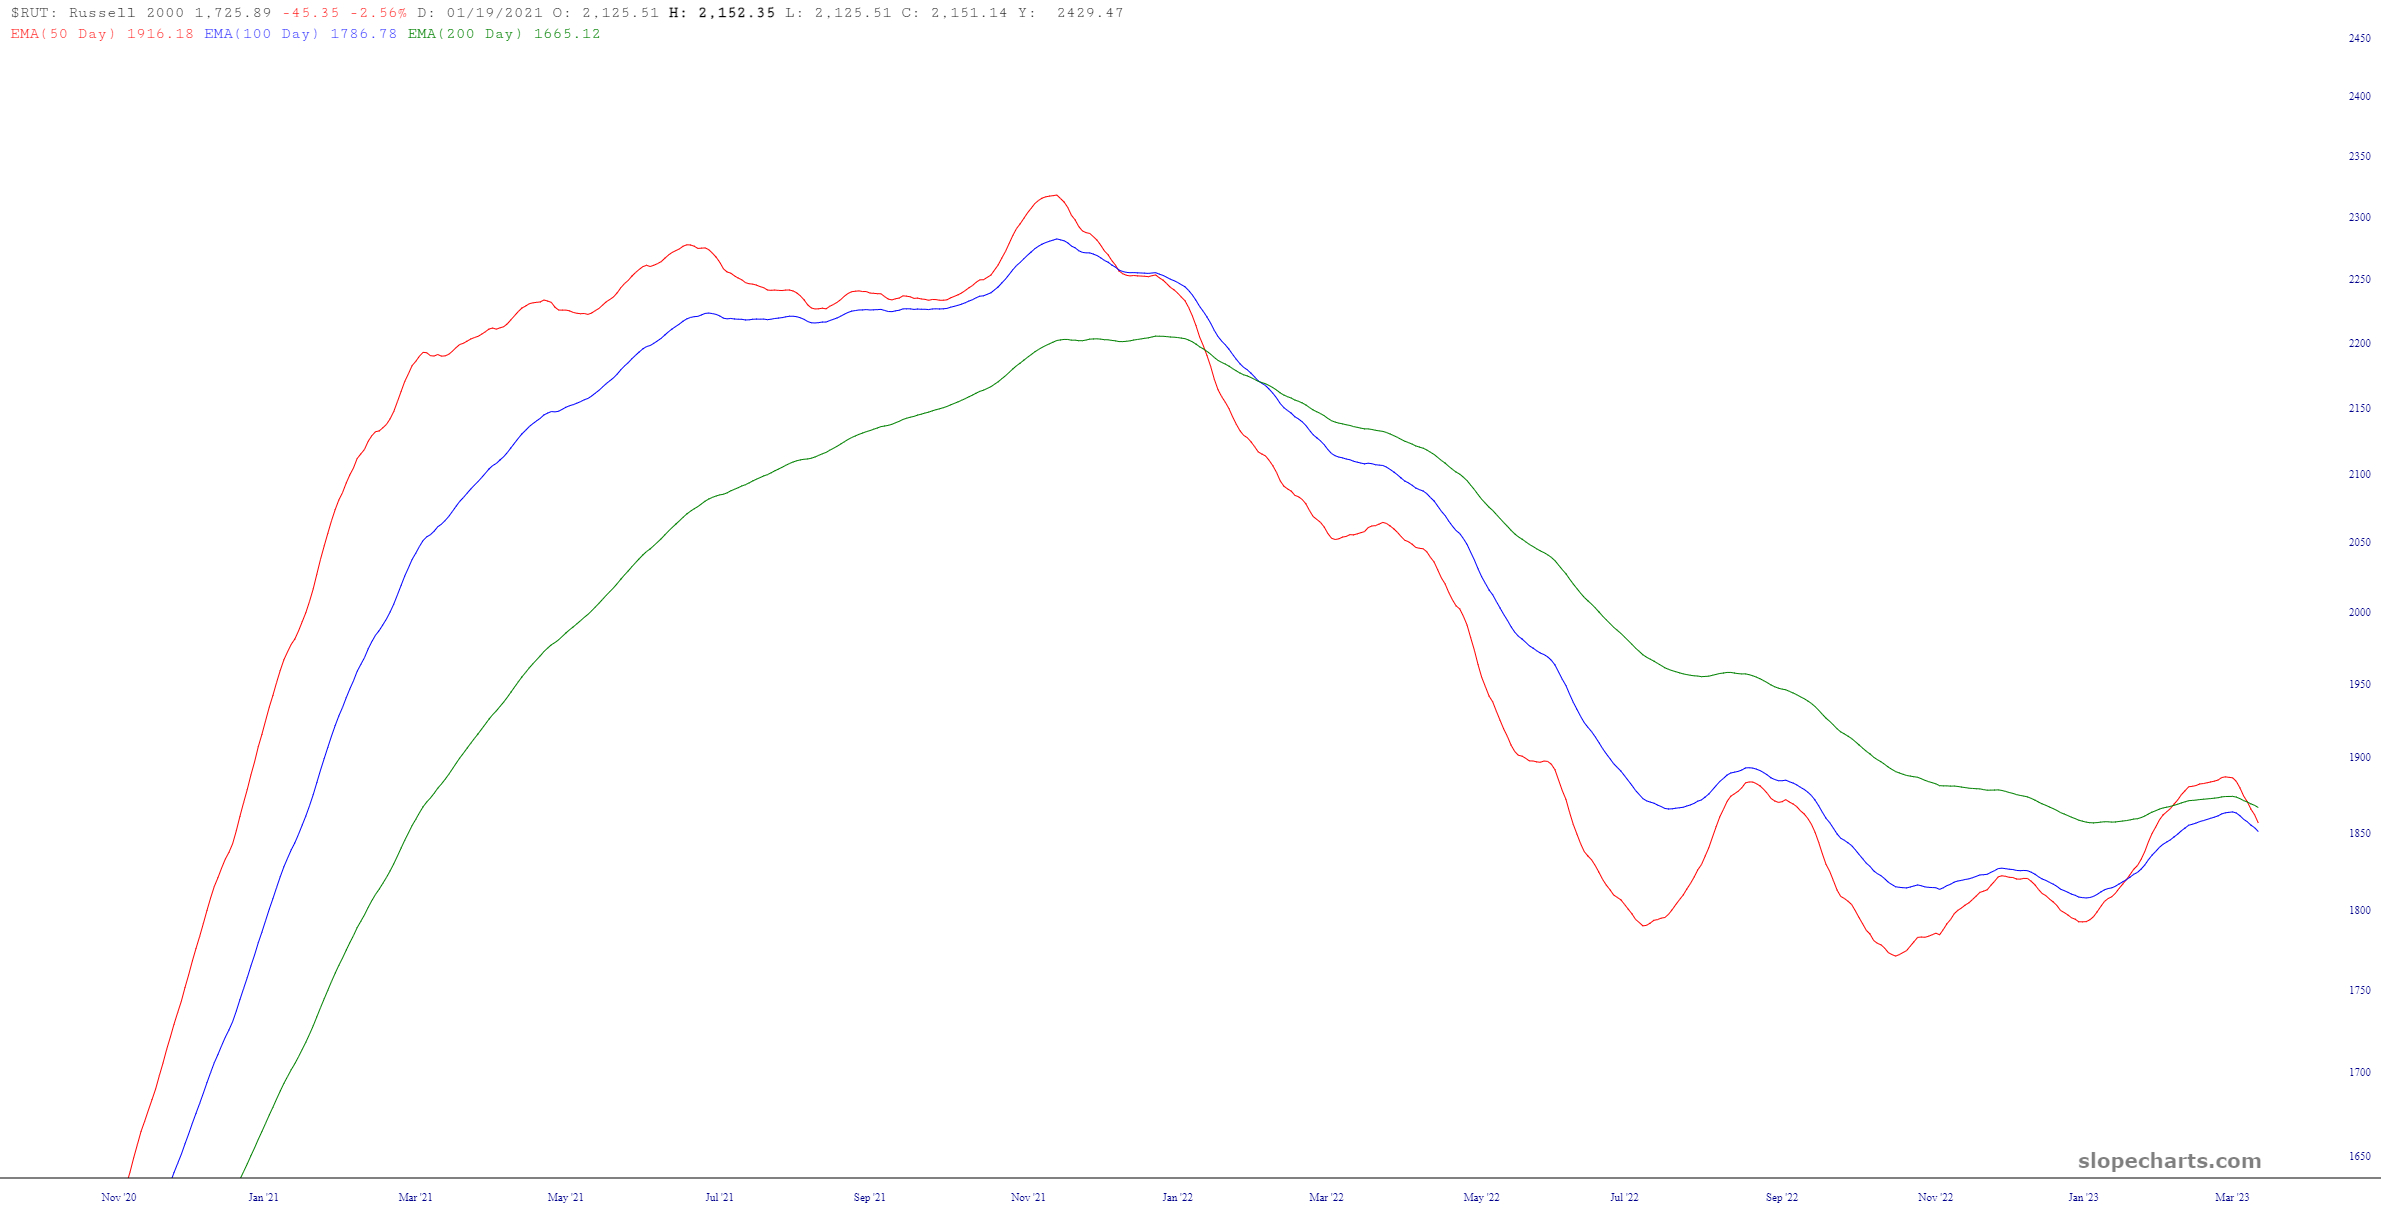
Russell 2000

S&P 500
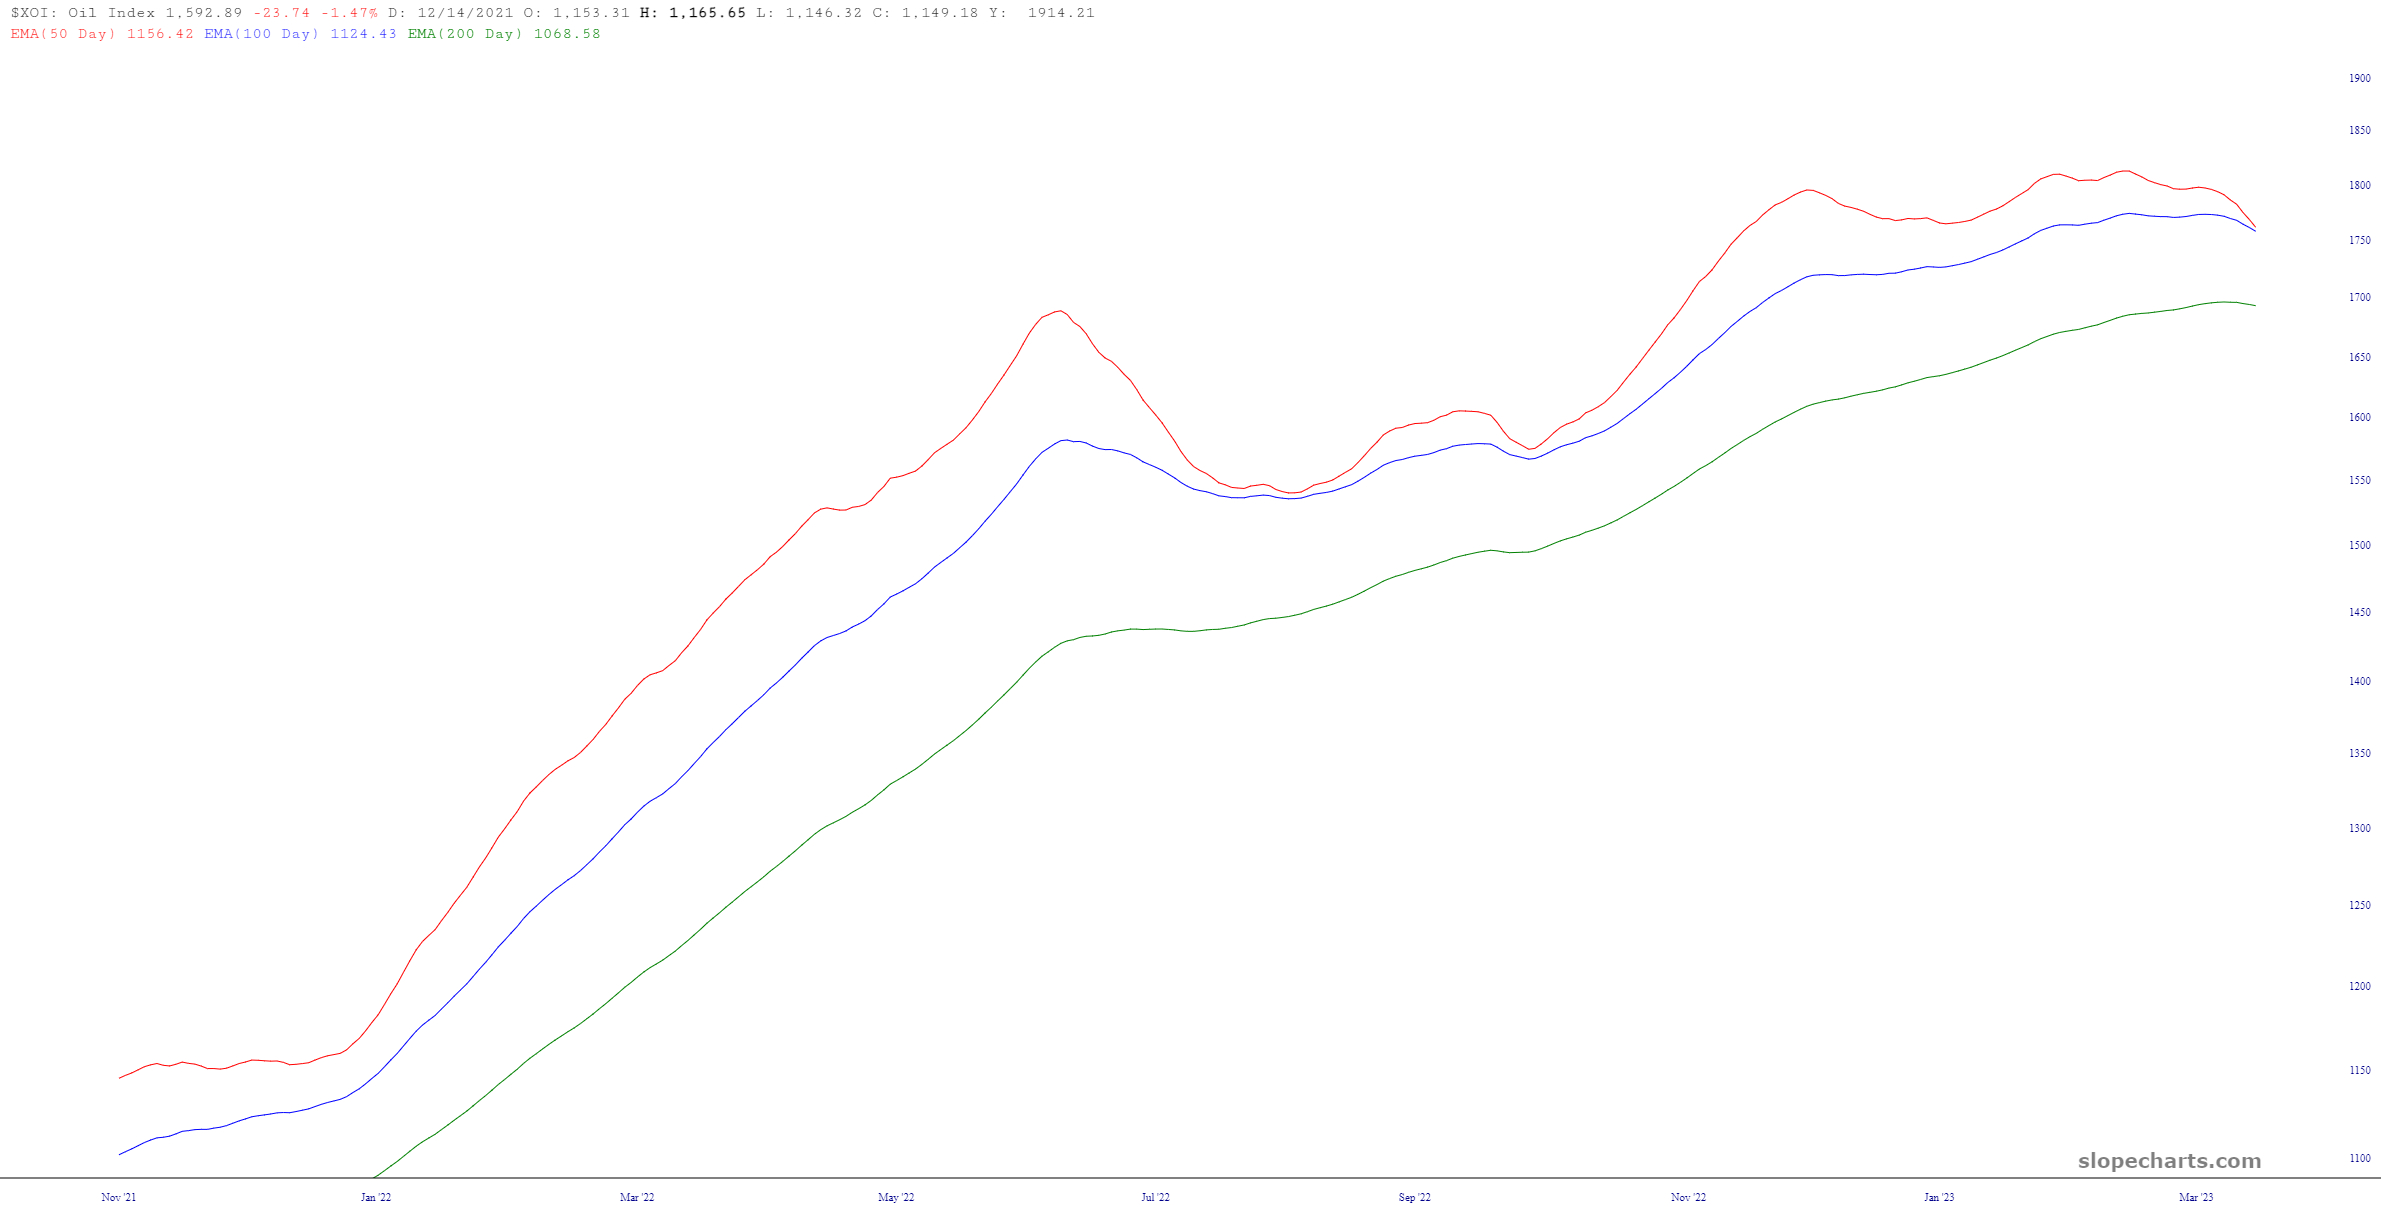
Oil and Gas Index
More By This Author:
A Baker’s Dozen Of ETFs
Head & Schwaber Pattern
ETF Shortcuts - A Brief Look At ETFs

Comments
Log in or sign up to join the conversation.