

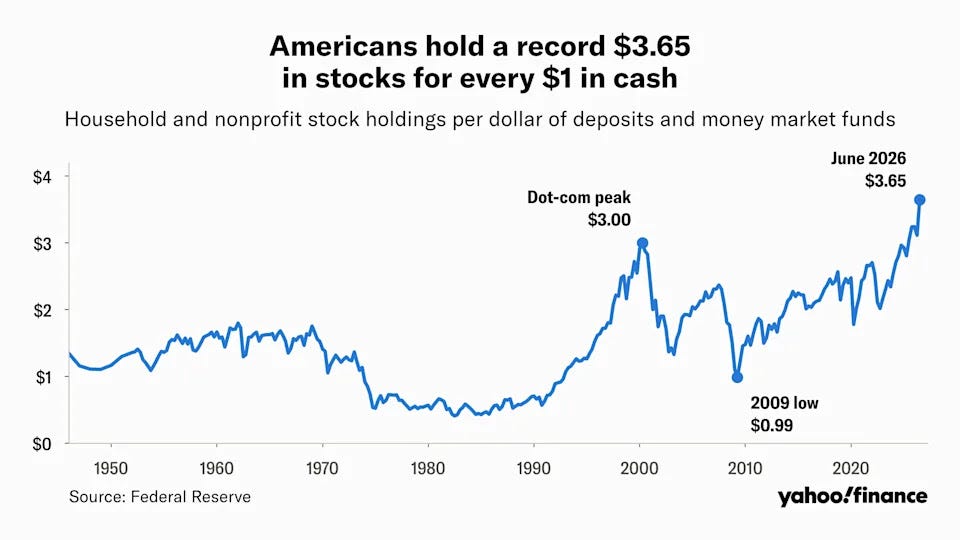
At any given time, investors have a choice of broad asset classes, including stocks, bonds, cash, and real estate. The ratio of stocks to cash is especially telling, since stocks are volatile and cash is stable. So a preference for cash (i.e., bank accounts and money market funds) implies caution, while a preference for stocks implies optimism.
Where are Americans now? Apparently we’re as optimistic as we’ve ever been, with more than $3 of equities for every dollar in cash, up from the historic average of around $2.
But Not All — Or Even Most — Americans
Those with the 10% highest incomes own virtually all publicly traded stocks, while the top 1% own about 75% of the total. Add several trillion dollars in soon-to-be IPOed AI companies — currently owned by the super-rich — and the concentration becomes even more extreme.
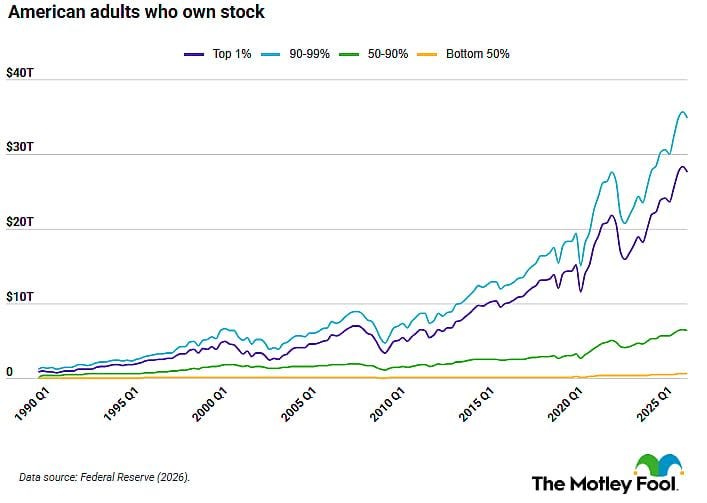
So rather than saying “Americans are optimistic,” let’s say America’s super-rich are euphoric. As for the rest, well, they’re not part of the emotional/financial equation.
A Global Perspective
The charts above may actually understate wealth concentration. Consider this, from Global Research’s Eric Buesing:
The Super-Entity That Owns the World
(Global Research) - In October 2011, three systems theorists at the Swiss Federal Institute of Technology (ETH) in Zurich published “The Network of Global Corporate Control.”3 Its authors called it the first investigation of the architecture of the international ownership network.4 Most people have never heard of it.
The Map
Stefania Vitali and her coauthors James Glattfelder and Stefano Battiston set out to put numbers on a suspicion many people already held: that a handful of corporations dominates the global economy.5 They started with Orbis 2007, a commercial database of about 37 million companies and investors. From it they pulled 43,060 transnational corporations in 116 countries, which are companies that operate in more than one country. Then they traced the ownership chains running into and out of those companies. The result was a network of about 600,000 entities joined by just over one million ownership ties.6
Ownership runs in loops. Say Company A owns shares in Company B, and Company B owns shares back in Company A. Control flows up through links like that, and some shareholders end up very powerful.7 The researchers built a new method so the loops wouldn’t inflate the totals.8
Who Holds the Control
The network formed a giant bow tie. At its center sat a very small, very dense core of 1,318 companies out of 43,060.9 Each core member was tied to about 20 others, and about three quarters of the ownership of core firms stayed with other core firms.10
Inside that core sat 147 firms the authors called an economic super entity. They held nearly 40 percent of the control over the economic value of all the transnational corporations in the study, measured by operating revenue, which is the money a company earns from its business. They also had almost full control over themselves.11 That’s 147 companies out of more than 43,000. In Glattfelder’s words, less than 1 percent of the companies controlled 40 percent of the network.12 The concentration held under all three models the authors used to estimate control.13
Read the rest here.
How Should We Respond?
Two possible conclusions can be drawn from the above:
The global elites who own everything control the markets, and won’t let stock prices decline. So we should follow their lead and load up on equities. Or…
When the next (long overdue) recession hits, the 1% will all head for the exits at once, causing a crash for the record books. And we should be on the sidelines when that happens.
Which is right? Number 2, obviously. This is a game that normal people shouldn’t play. Stay as far away from it as possible.



Comments
Log in or sign up to join the conversation.