
Spreads relative to 3 months continue to decline.
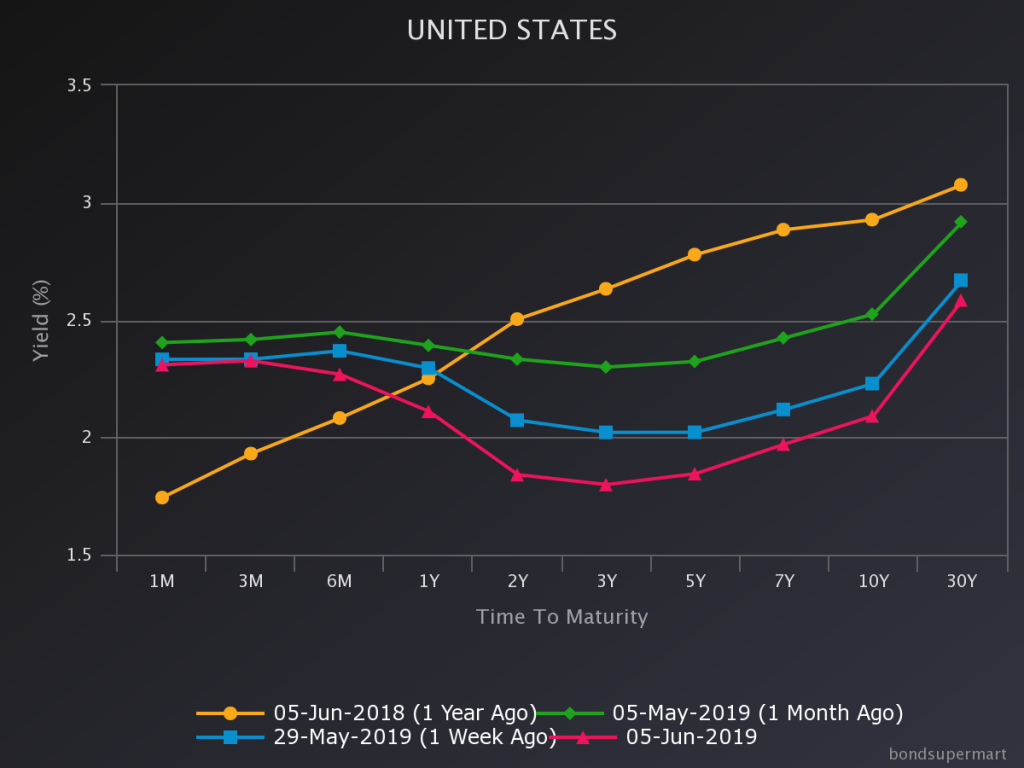
Source: BondSuperMart.com. On the run yields.
In other words, despite interruptions, key term spreads are declinining even as economic policy uncertainty increases (constant maturity yields):
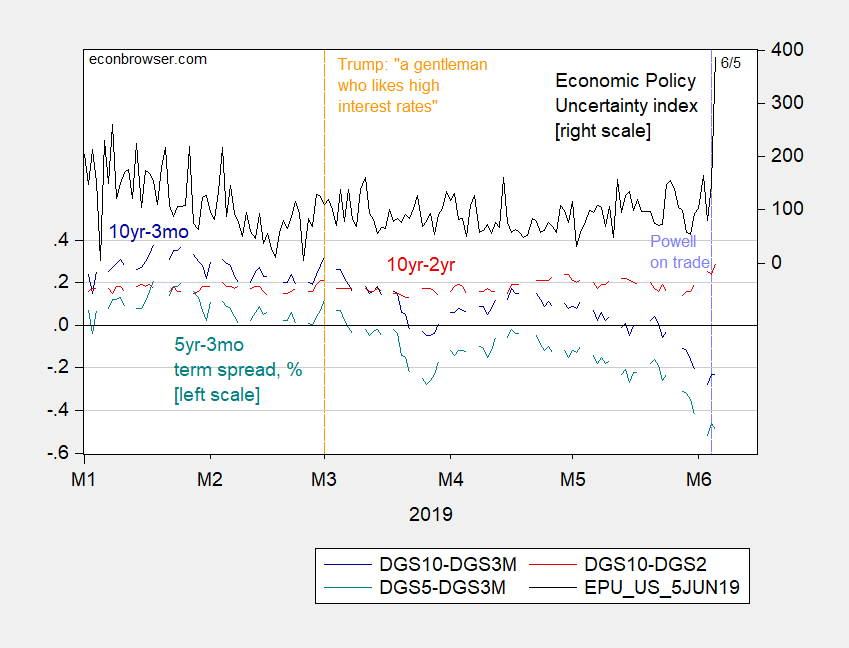
Figure 1: Treasury 10yr-3mo spread (blue, left scale), 10yr-2yr (red, left scale), 5yr-3mo (teal, left scale), in %; and Economic Policy Uncertainty index (black, right scale). Source: Fed via FRED, US Treasury, and policyuncertainty.com, accessed 6/5/2019.
A longer term perspective highlights the inexorable nature of the term spread evolution.
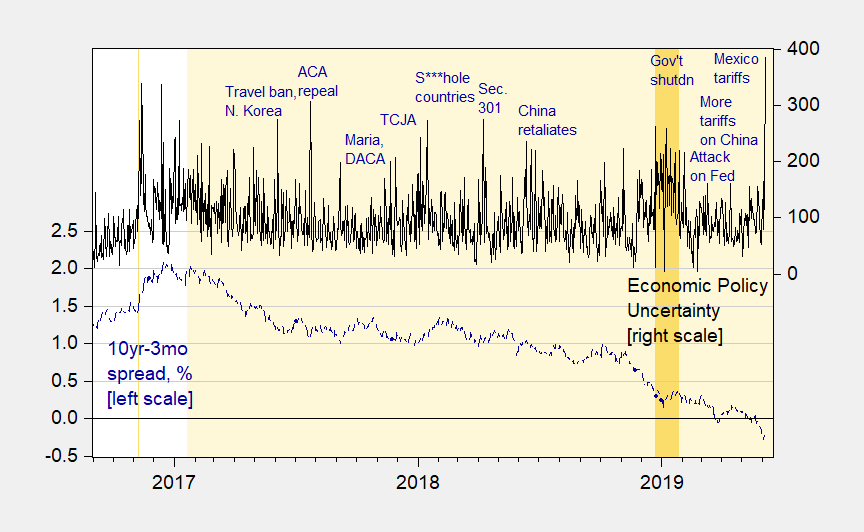
Figure 2: Treasury 10yr-3mo spread (blue, left scale), in %; and Economic Policy Uncertainty index (black, right scale). Source: Fed via FRED, US Treasury, and policyuncertainty.com, accessed 6/5/2019.
Is uncertainty being manifested in higher risk? One way to assess risk is by looking at credit spreads.
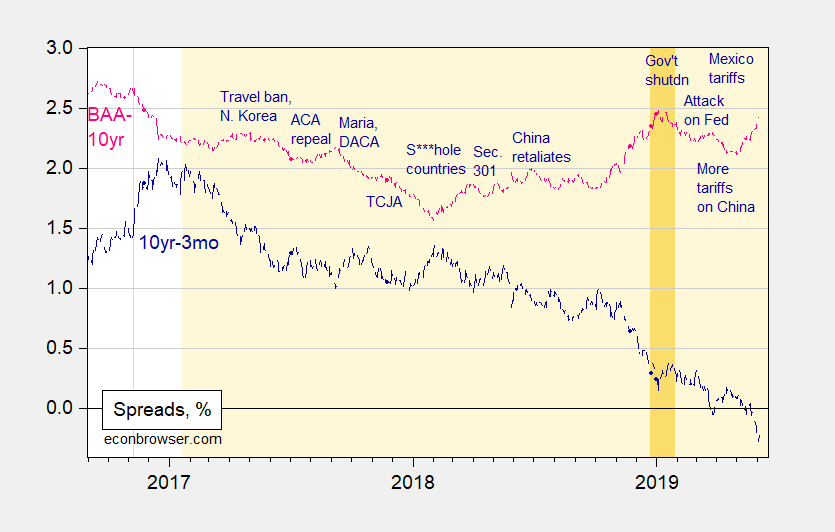
Figure 3: Treasury 10yr-3mo spread (blue), and Moody’s Baa corporate bond yield minus 10 year Treasury yield (pink), in %. Source: Fed via FRED, US Treasury, and Moody’s via FREDb, accessed 6/5/2019.
The Baa-10 year spread is an imperfect measure (see Gilchrist and Zakrajsek for better measures), but it’s easily accessible. As the term spread has declined, the credit spread has increased since the about March 2018, as the Trump administration declared protectionist measures. The trends — down and up — steepened starting in September 2018.
For full measure, here’s a proxy for below-investment-grade bond credit spreads, adjusting for maturities.
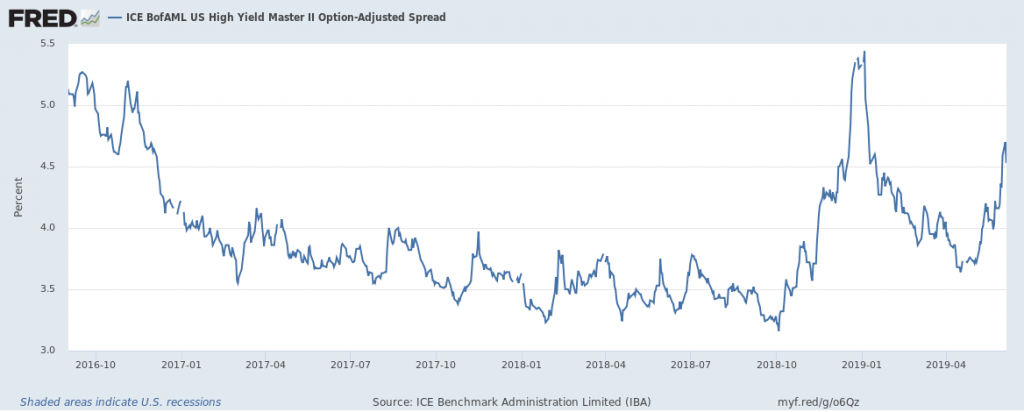
Figure 4: ICE BofAML High Yield Master II Option-Adjusted Spread, in %. Source: FRED, accessed 6/5/2019.
What to make of all these spreads. I don’t know — but Miller (2019) does suggest something. Unfortunately, he does not provide the recession probability associated with “the best” model at, say, one-year horizon.


Comments
Log in or sign up to join the conversation.