

Yesterday we saw a clear break above the key psychological level of $8,000 per bitcoin. Now the question on everyone's mind is where did this move come from and is it sustainable?
Now, I know that many of you are reading this note for just one reason and we have some rather unique crypto observations for you below but before we get into that it is important to always bear in mind that a portfolio that is made up of only crypto is like a recipe that's all spices. Cryptoassets are highly volatile and so should only make up a small part of your overall portfolio.
Today's Highlights
- Mixed Feelings
- Gold Line
- Healthy Crypto Market
Traditional Markets
Stock markets are displaying very clear mixed emotions at the moment. On the one hand are all of the fears about the ongoing trade war and the Fed's tightening of monetary policy. On the other hand, corporate earnings are going well.
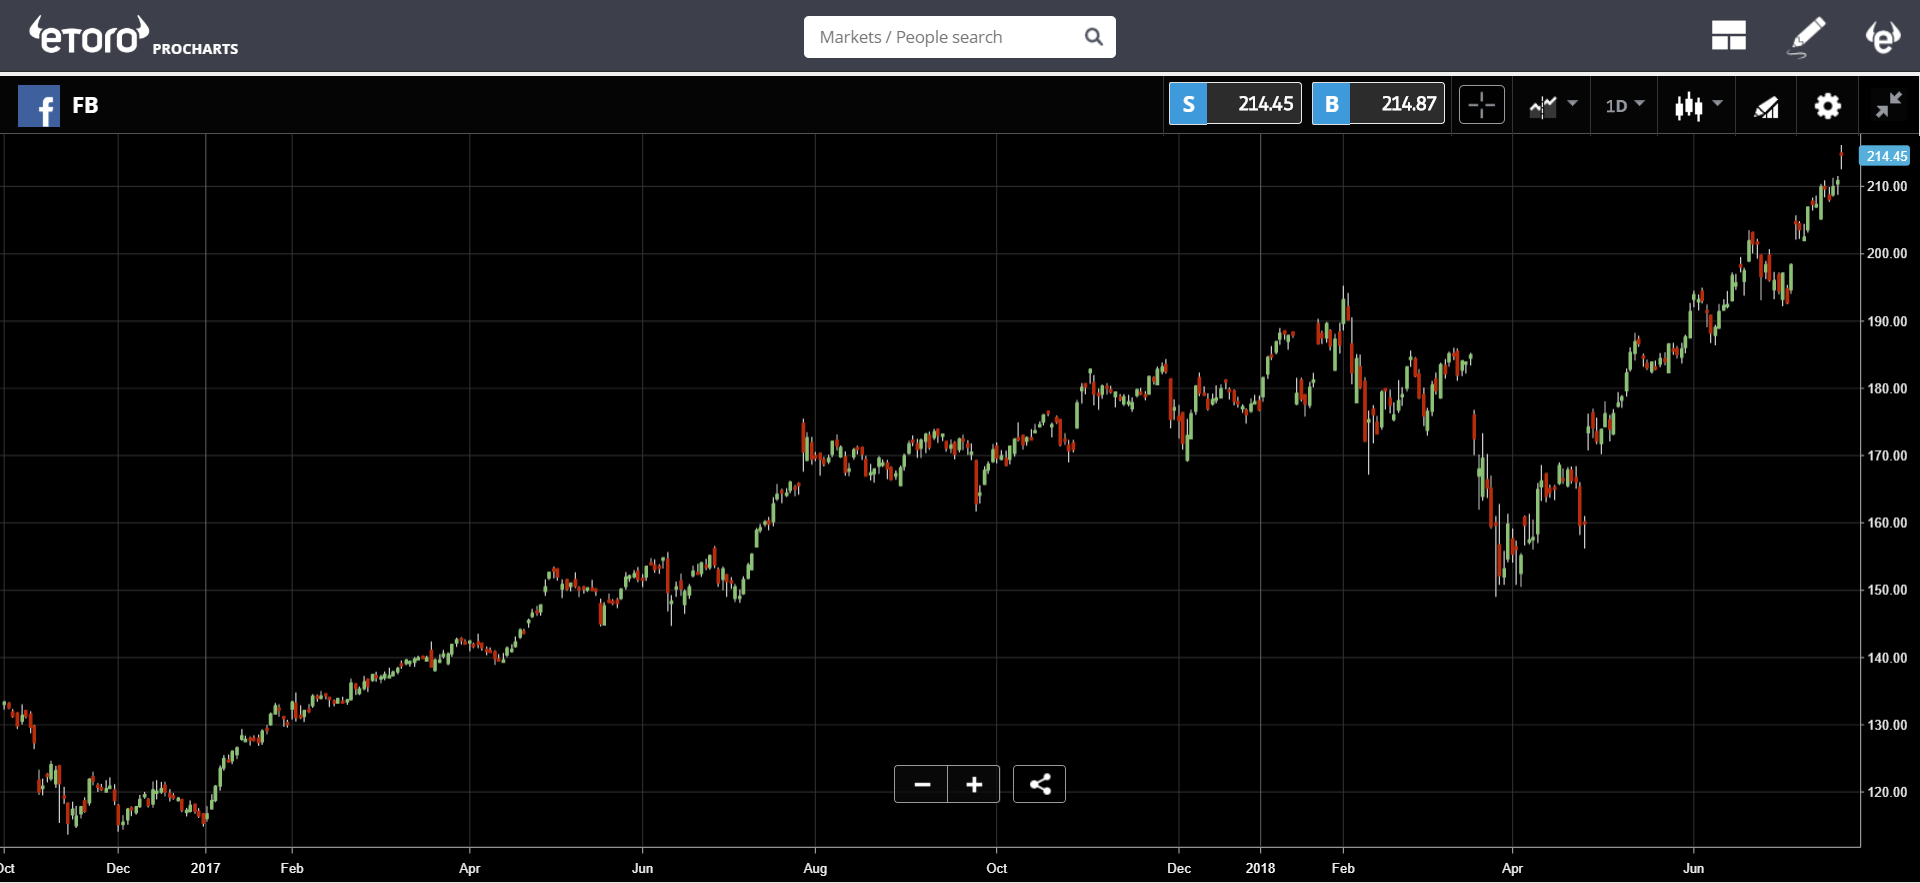
Facebook reports today after the bell. Their stock closed yesterday at a record $214 per share in anticipation of an outstanding report.
(Click on image to enlarge)
Gold Line
The precious metals have been getting hammered these last few weeks. From what it seems, the reason for the slide is mainly due to Trump's new tariffs on Steel and Aluminum. Meanwhile, gold, silver, platinum, and copper are getting really cheap.
Of course, there's no telling just how low they might go but a contrarian trader might want to take note and even consider scaling into a long-term position.
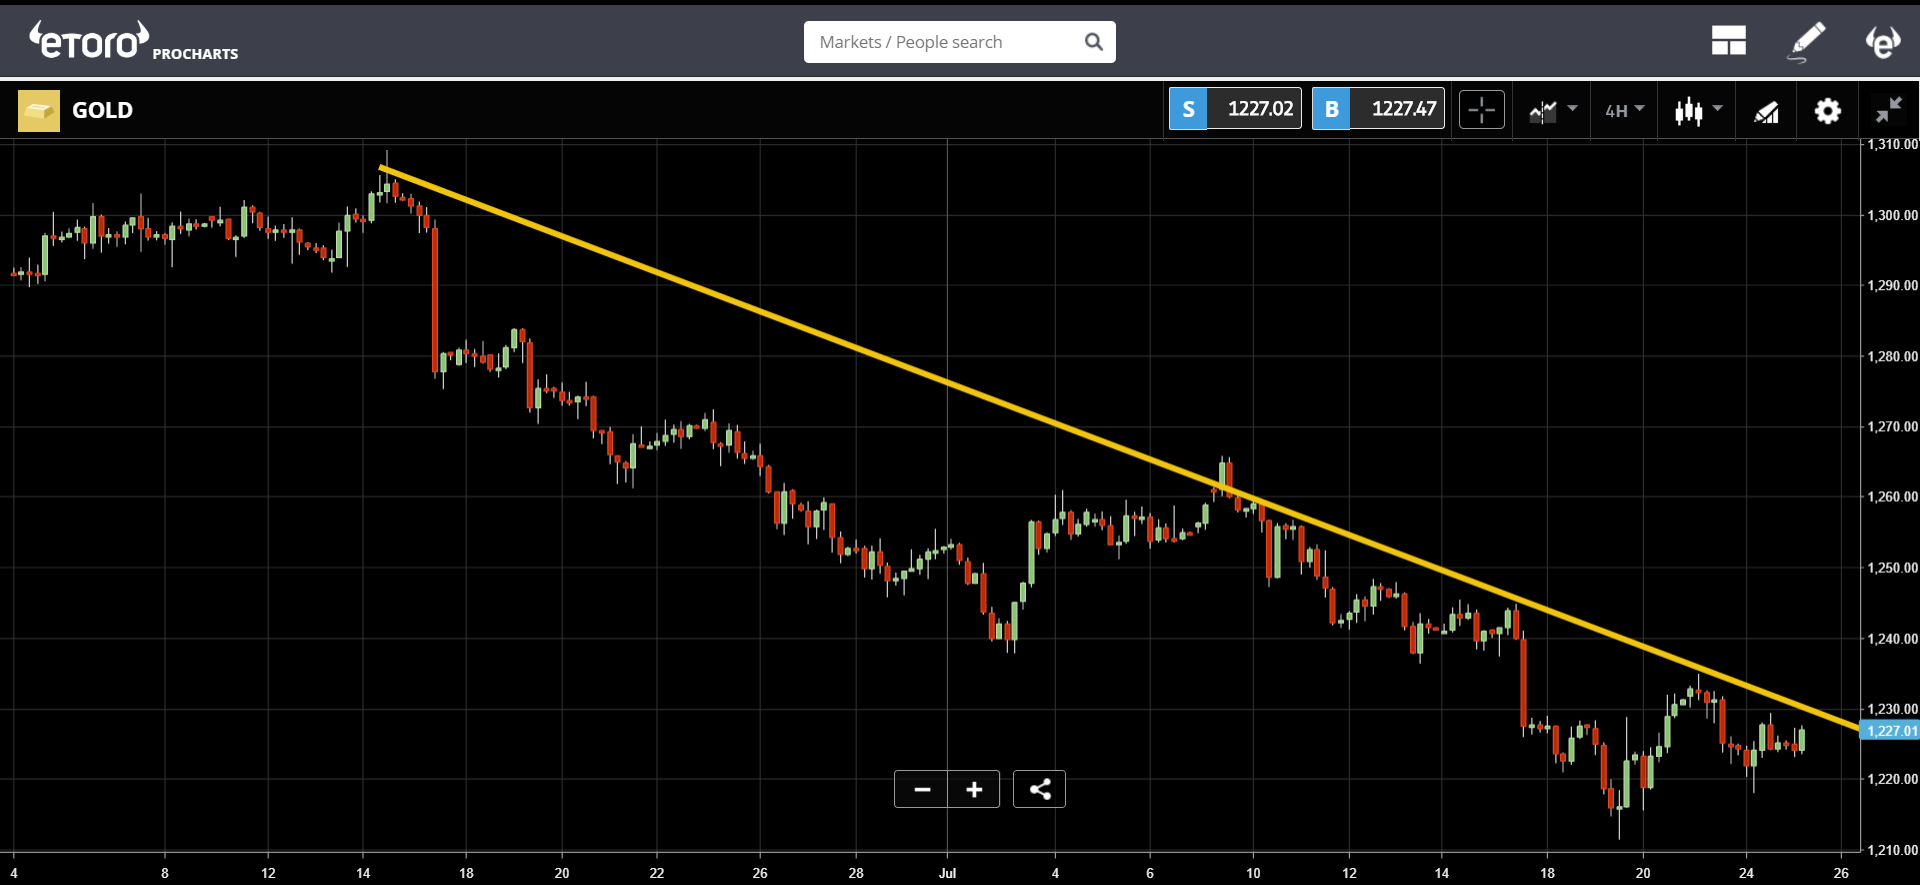
This morning, I noticed the following trend line on gold, which seems to be undergoing a rather serious test at the moment.
(Click on image to enlarge)
Crypto Market's Healthy Rally
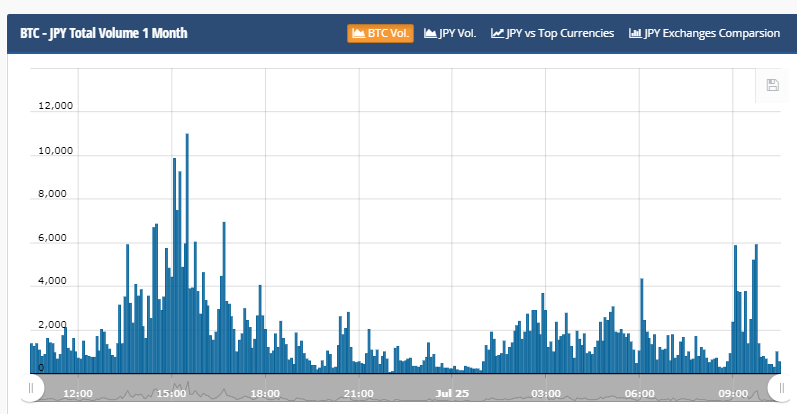
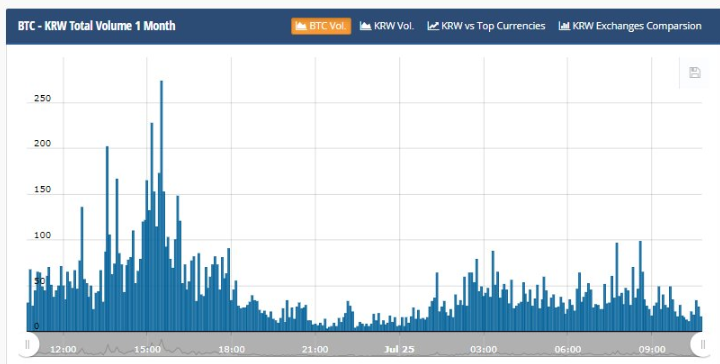
According to the volume on exchanges, it seems clear that the rally is being led by East Asia. This is depicted in the following 4 graphs.
The leader is the Japanese Yen. Notice the big mountain at the time of the surge above $8,000, which took place at approximately 13:30 to 15:00 on these graphs...
(Click on image to enlarge)
The next is South Korea, who are some of the biggest cryptotraders in the world. The peak here is only at 273 BTC but the correlation between the volumes and the price movement is very clear.
(Click on image to enlarge)
The US Dollar had a spike as well but it was much more focused. Meaning that the Americans only participated during the extreme part of the surge and less in the before and after party.
(Click on image to enlarge)
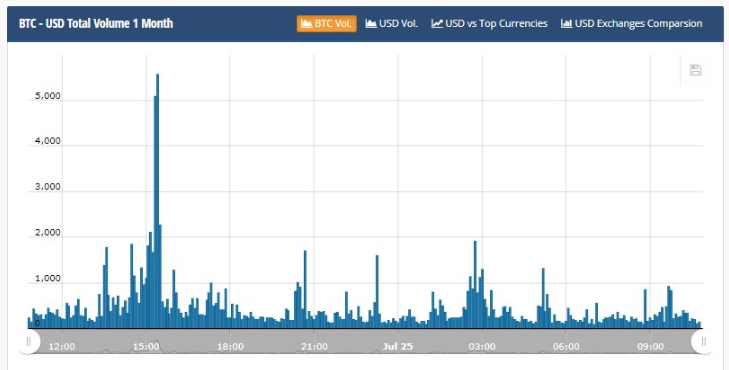
For the purpose of this analysis, I'd like to include volumes of the USDT (Tether), which were notably unaffected and remained constant throughout the ordeal.
(Click on image to enlarge)
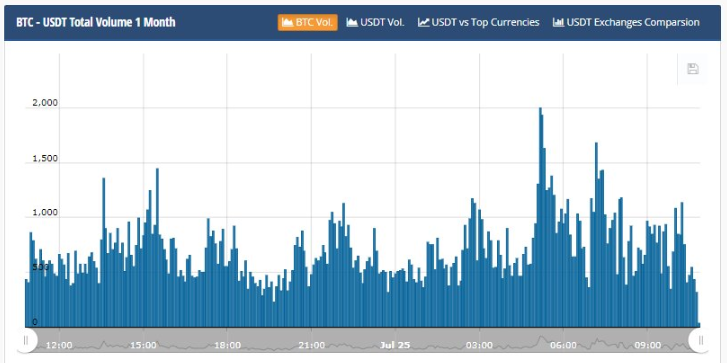
Of course, all of the above comes from Cryptocompare who generally pulls their data from online exchanges. When we analyze the bitcoin blockchain, we see something even better.
In this graph, we can see that the on-chain activity is indeed increasing lately and has now topped 2.5 transactions per second for the first time since February.
(Click on image to enlarge)
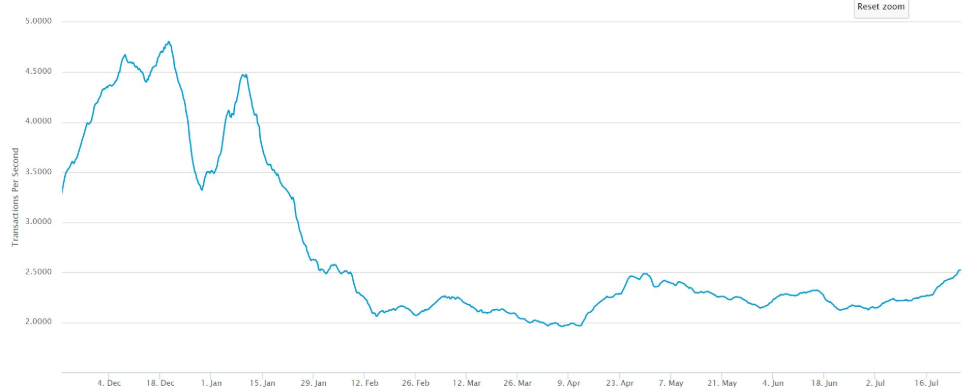
This is a clear sign that whatever the reasons for the surge...
- Possible Bitcoin ETF
- Blackrock's confirmation of crypto interest
- Goldman Sachs crypto interest
- Fear of Bank of Japan policy
- anything else
... the excitement doesn't stop at speculation and we can indeed see momentum building in the Bitcoin network.

Comments
Log in or sign up to join the conversation.