

The quarter is coming to a close, and if there is one part of the market that is turning the calendar as a winner, it's the semiconductors. As we noted in yesterday's Chart of the Day, of all S&P 500 industry groups, the semis blew away the rest of the pack this quarter.
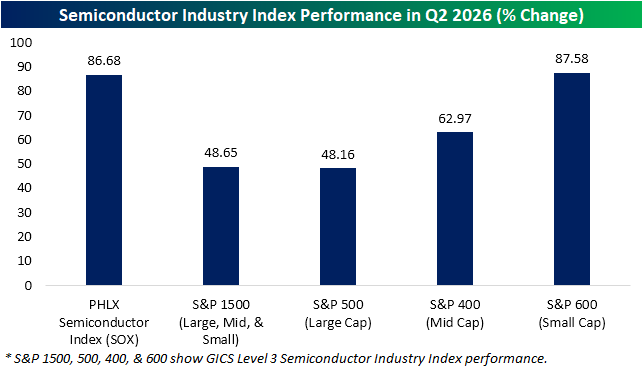
There are multiple ways to look at the semis. While squaring away S&P 500 members that are part of the industry is one option, another more widely quoted version is the PHLX Semiconductor Index (SOX). Additionally, there are the mid-cap (S&P 400) and small cap (S&P 600) semiconductor industry indices.
As shown below, whereas the S&P 500's semiconductor index was up an impressive 48% on the quarter, the SOX blew the doors off, up almost 87%. Likewise, the mid- and small-cap semis outperformed the large cap semis with gains of 63% and 88%, respectively. Of course, index construction and methodology between those proxies on the space differ, but when it comes to the S&P 500 industry group versus the SOX, it was a record gap for any quarter since the second half of 1994.
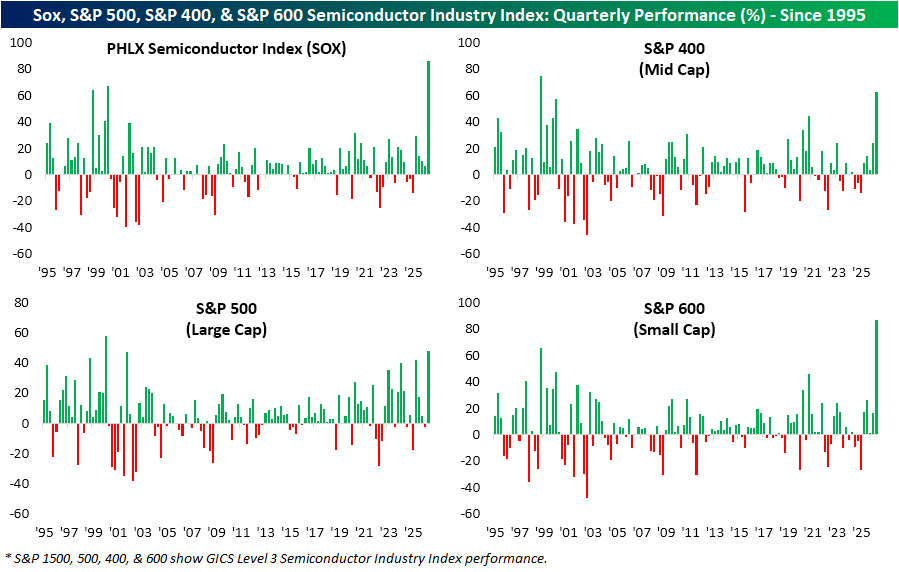
Below we show the quarterly performance of the SOX since 1995 in addition to the performance of the S&P 500, 400, and 600 semi industry indices. Again, it was a record showing for the SOX in Q2. Like the SOX, it was also a record quarter for the semis within the small cap S&P 600 semiconductor index. The mid-cap S&P 400 semiconductors had its second best quarter to date (behind a 75.3% rally in Q4 1997), and the large cap S&P 500 semiconductor industry (which is now the largest industry group by weight), had its best quarter since Q1 2000.
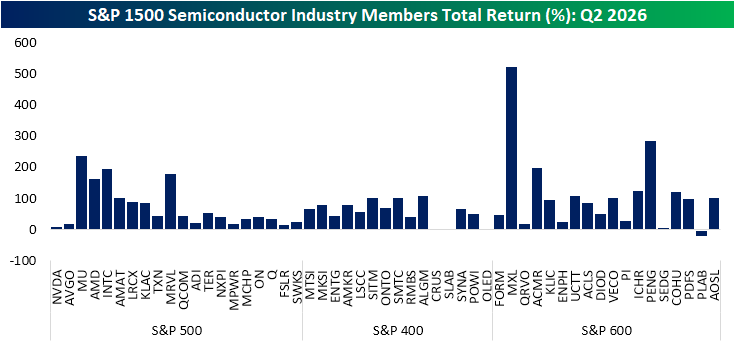
Below, we show the individual quarterly returns of S&P 1500 semiconductor members, sorted from largest to smallest by market cap.
At the top, two of the largest names, Nvidia (NVDA) and Broadcom (AVGO), actually posted some of the smallest returns of the industry in Q2. Granted, the next largest stock and newest member of the trillion dollar market cap club, Micron (MU), was one of the best performing semis. Looking down the list, there were also a couple of huge gainers among the small caps like an astounding 523% gain from Maxlinear (MXL) (XML) and a 286% rally from Penguin Solutions (PENG). Further, only two were in the red: Universal Display (OLED) and Photronics (PLAB).
Again, while semiconductor returns in Q2 were good everywhere, at the index level it was a massive gap between the performance of small caps and the SOX versus the S&P 500 or the mid-cap S&P 400. The reason for the gap is multi-faceted. For starters, composition of the indices differs. For example, the SOX, unlike the S&P indices, can include non-US headquartered companies such as Taiwan Semi (TSM) and has no earnings requirements.
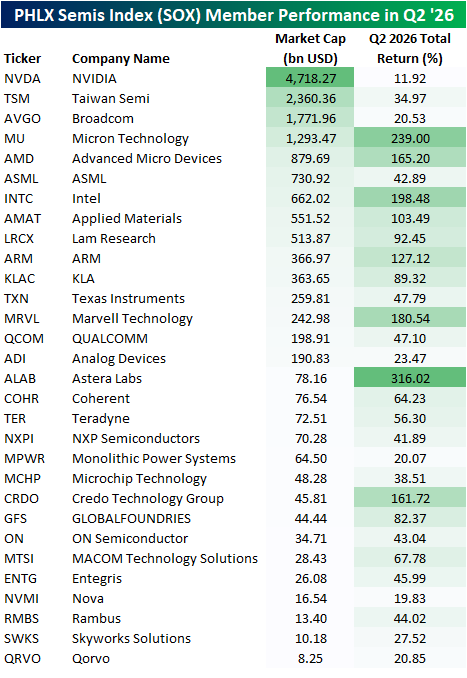
Further methodological differences mean the same stock can have different impacts between two indices. As a part of the S&P 500, the S&P 500 Semiconductors index is weighted by pure float-adjusted market capitalization, whereas the SOX applies a tiered cap structure; capping its largest constituent at 12%, the second-largest at 10%, the third-largest at 8%, and all others at 4% with excess weight redistributed to smaller constituents. In other words, the largest stock in both indices (which today is NVDA) has a greater impact on the S&P 500 than it does in the SOX where its impact is dampened due to the cap. NVDA was the single worst performer of SOX members in Q2 with an 11.9% gain. The runner-ups in size, Broadcom (AVGO) and Taiwan Semi (TSM), likewise were underperformers.
The weight cap meant this underperformance was less of a drag on the SOX whereas the uncapped methodology of the S&P 500 resulted in the weaker performance of Nvidia to be more of a factor. Conversely, the smaller market cap stocks with big runs like Astera Labs (ALAB) or Marvell Tech (MRVL) would have smaller impacts on an S&P index and amplified impacts on the SOX.


Comments
Log in or sign up to join the conversation.