

Since October 1, 2011, the S&P 500 has risen 82% on the heels of strong earnings growth.
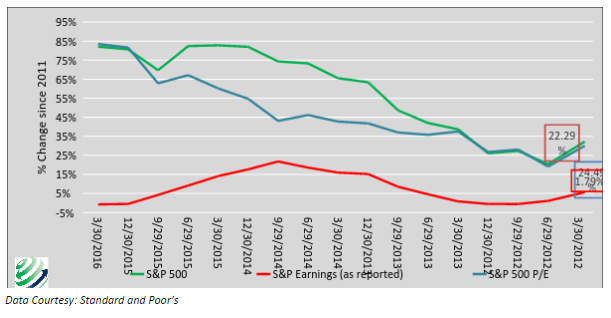
Let’s start over. Since October 1, 2011, the S&P 500 has risen 82% on the heels of a 0.75% decline in earnings. The price to earnings ratio over that time period has risen 83%, with price gains contributing 99% to the increase. Prices have risen substantially, while earnings have actually fallen. The chart below highlights the growing gap between earnings and the S&P 500.
Growth of the S&P500 P/E and its Components since 2011
Data Courtesy: Standard and Poor’s
This chart illustrates that sentiment and momentum, and not fundamental rationale are the factors driving equity markets higher. To justify even a neutral position in equities we would need to see signs of stronger economic growth and revived corporate earnings growth. Unfortunately, the current outlook does not support either of those prerequisites.
With the information provided above as a backdrop, the following table from Goldman Sachs offers further context on current U.S. equity valuations.
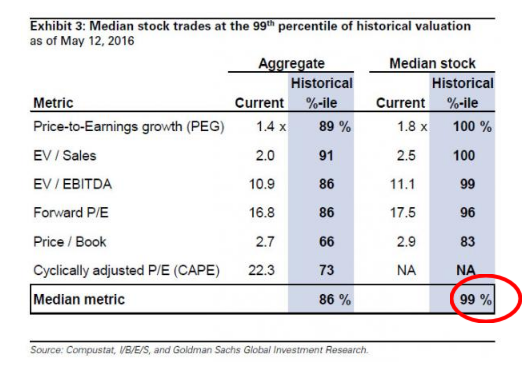
We are sympathetic to the idea that there are few alternatives for investors in desperate search of returns, but the risk-reward imbalance in the U.S. equity markets is severe. Stay long patience!



Comments
Log in or sign up to join the conversation.