

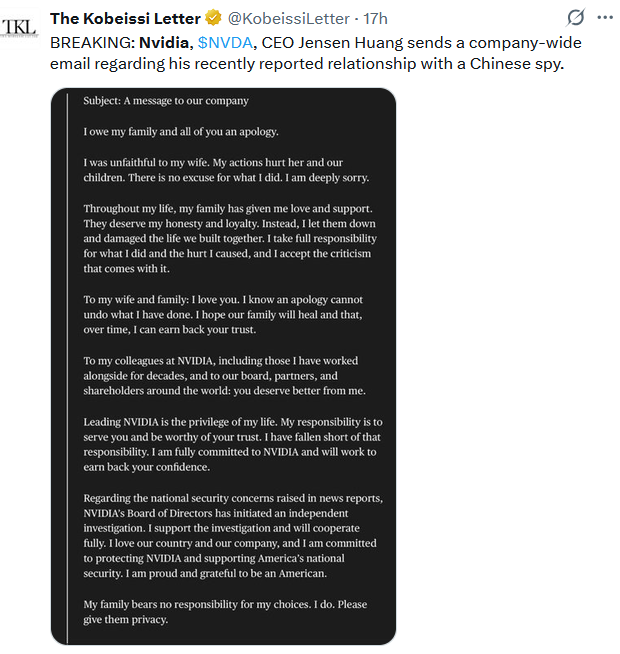
Nvidia opened down by roughly 5% on Monday after it was disclosed that its CEO, Jensen Huang, had an affair with a woman identified by US officials as a Chinese intelligence asset. While Huang admits to the relationship, the allegations that she was a spy are unproven, and Nvidia says no company or security information was compromised. So why did the stock drop? It wasn’t because of the affair, but because of what Huang has been worth in Washington.
Consider his record. He has met President Trump repeatedly since 2025. After being left off the May delegation to China, Trump called him, and he joined the trip at a stop in Alaska. He attended the state dinner for Xi Jinping in September. He personally lobbied to permit H200 sales to Chinese customers over the objections of national security officials, and he won.
That access was an important corporate asset. It unlocked a China business that export controls would otherwise have closed.
Huang’s access to the President is now impaired. Three House committee chairs overseeing foreign affairs, intelligence and China policy have asked Huang to appear on November 18, one day after Nvidia reports earnings. Those committees write the rules governing what Nvidia may sell abroad.
AMD, its chief competitor in the data center GPU market, is rallying by nearly 5% on the news. Thus, the market is not questioning demand for chips. It is repricing Nvidia’s political position and its deep moat.
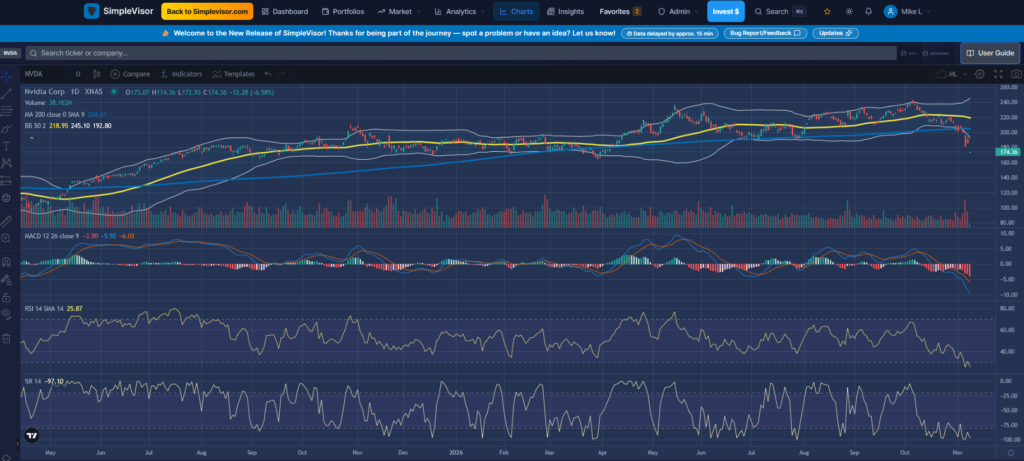
The graph below, courtesy of SimpleVisor, shows that many of Nvidia’s technical gauges like RSI, MACD, and Williams are deeply oversold. While it may appear to be cheap technically and fundamentally, caution is warranted until we learn more about the affair and what it may mean for Nvidia’s future.
What To Watch Today
Economy
Time (ET) | Release (Period) | Prior | Consensus | Forecast |
|---|---|---|---|---|
6:00 a.m. | NFIB Small Business Optimism (Oct) | 97.9 | 97.7 | 97.6 |
8:30 a.m. | CPI, MoM (Oct) | 0.6% | 0.3% | 0.2% |
8:30 a.m. | CPI, YoY (Oct) | 3.7% | 3.9% | 3.8% |
8:30 a.m. | Core CPI, MoM (Oct) | 0.3% | 0.2% | 0.2% |
8:30 a.m. | Core CPI, YoY (Oct) | 2.6% | 2.8% | 2.7% |
1:00 p.m. | 10-Year Note Auction | 5.300% | n/a | n/a |
Earnings
Company (Ticker) | Timing | EPS Est. | Rev. Est. |
|---|---|---|---|
TransDigm (TDG) | Before open | $12.21 to $12.31 | $2.94B |
Sea Limited (SE) | Before open | $0.94 to $1.04 | $8.32B |
On Holding (ONON) | Before open | $0.39 to $0.50 | $1.14B |
Venture Global (VG) | Before open | $0.50 | $4.64B |
CoreWeave (CRWV) | After close (call 5:00 p.m.) | −$1.55 to −$1.17 | $3.50B to $3.54B |
Fed speakers: Governor Waller, economic outlook (4:00 a.m., London). Dallas Fed President Logan, a 2026 voter (9:35 a.m.). Kansas City Fed President Schmid (1:30 p.m.). Vice Chair for Supervision Bowman, economic outlook (3:30 p.m. and 6:30 p.m.). Note: the bond market closes Wednesday for Veterans Day while stocks stay open.
All times Eastern. Economic data: Trading Economics, release times confirmed against the BLS schedule. Earnings: Earnings Whispers and Kiplinger, ranges shown where estimates differ. Fed: Federal Reserve Board calendar and Trading Economics. As of Nov. 9, 2026.
Market Trading Update
Yesterday, we discussed how liquidity is tightening and the technical damage last Thursday did to the S&P 500. Today, I want to focus on where that damage was worst: the AI stocks selloff, because price and earnings are now telling two very different stories.
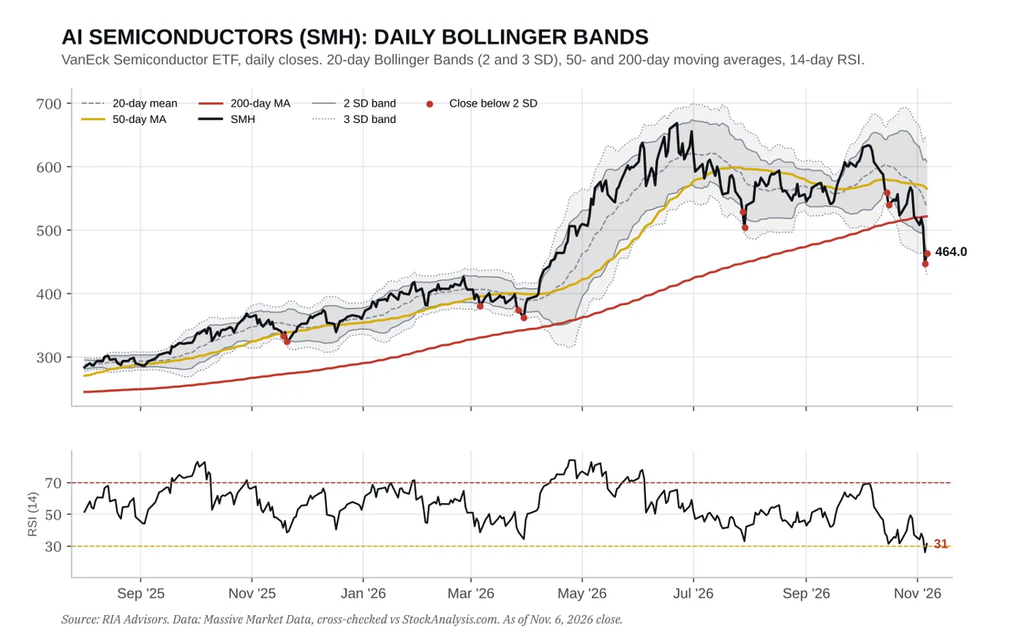
First, let’s start with the tape following last week’s selloff. The VanEck Semiconductor ETF (SMH) closed Friday at $463.96, down 31% from its June 22 high of $668.91. Thursday’s 11% plunge was its worst session since March 2020. SMH now sits 11% below its 200-day average near $522 and 18% below its 50-day. The 14-day RSI bottomed at 26 before bouncing to 31. That’s deeply oversold, but oversold is a condition, NOT a signal.
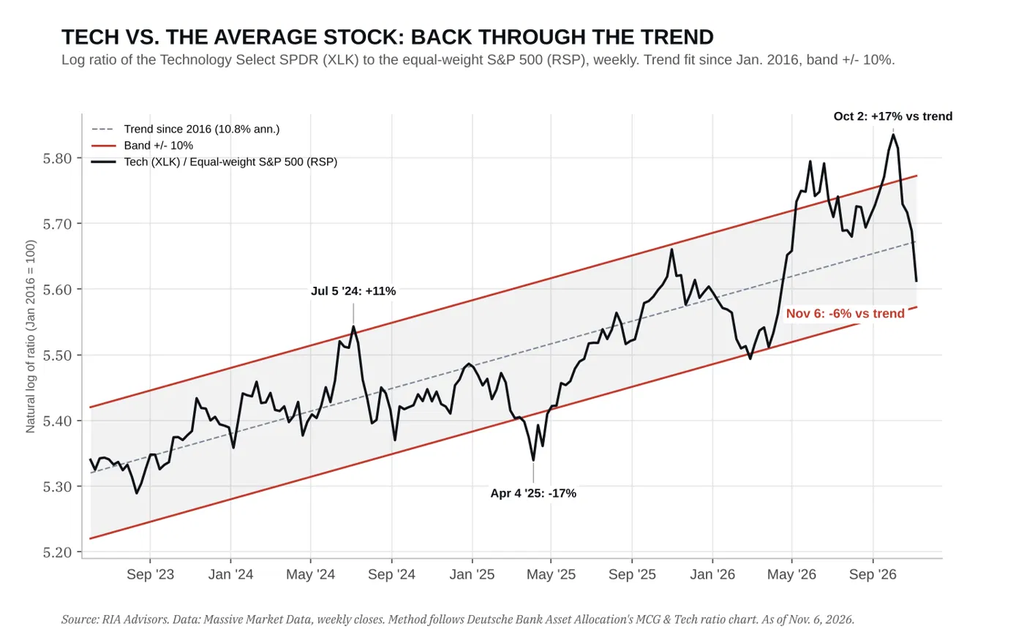
Furthermore, the relative picture is just as dramatic. Deutsche Bank Asset Allocation recently showed mega-cap growth and tech breaking below their long-run trend channel against the rest of the S&P 500. We rebuilt that work using Technology (XLK) against the equal-weight S&P 500 (RSP). On October 2, tech was running 17% above its decade-long relative trend. Five weeks later, it’s 6% below it. The entire 2026 premium is gone.
However, this is where the setup gets more interesting. While Technology prices broke, the earnings didn’t. Combined operating income for eight AI leaders (Nvidia, Broadcom, AMD, Micron, Microsoft, Alphabet, Meta and Amazon) hit $243 billion in the second quarter, up 71% from a year ago. Six of the eight have already reported the next quarter, and they’re up another 55%. JPMorgan makes the same point about Asian tech, where roughly 80% of companies still have positive earnings revisions.
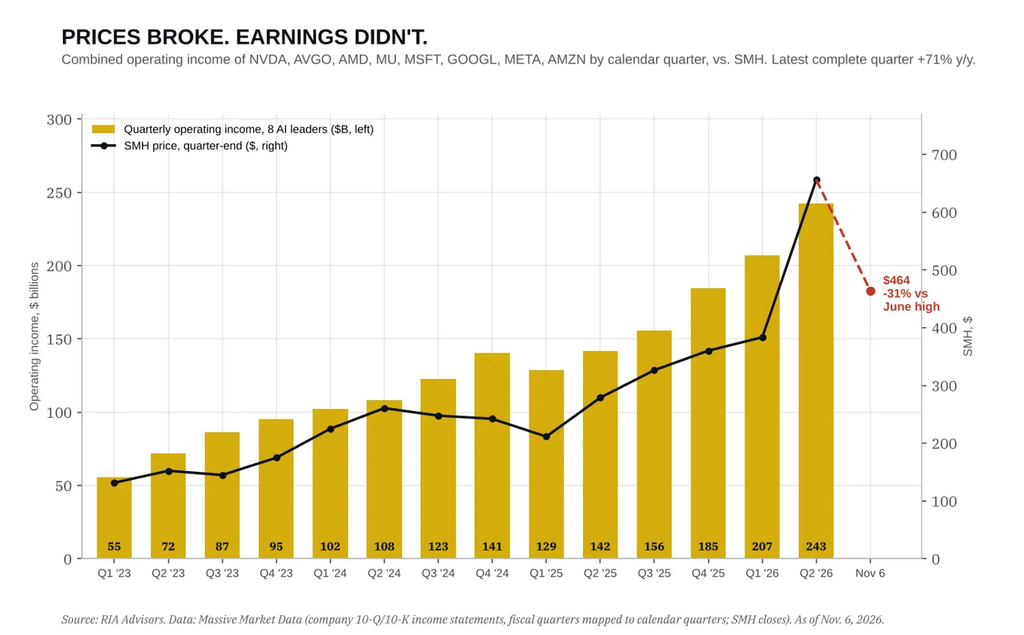
So, the question is simple: “Is the market simply wrong?” Not entirely. The crack is in the economics of supplying AI, not in the demand for it. JPMorgan notes that the major cloud providers raised quarterly capex by roughly $45 billion in Q3, even as new cloud revenue totaled just $13 billion. Meta’s third-quarter operating income fell to $13 billion from $20.5 billion a year earlier. That’s what spending outrunning revenue looks like, and that is where the risk lives when “AI winners” are priced for perfection. Bob Farrell’s Rule #2 applies here. Excesses in one direction lead to an opposite excess in the other.
So what do we do? A washout that leaves earnings intact is usually an opportunity, but the trend has to confirm it first. Our growth tranches stay on hold until the technical backdrop improves. Rebalance AI exposure back to target weights, favor names with visible earnings growth, and trim speculative positions that rely on borrowed money rather than cash flow. CoreWeave reports Tuesday after the close and Applied Materials on Thursday, so both will test the “capex forever” thesis this week.
Yesterday, the market strongly held support at the 200-day moving average. This is a good start, but it needs to hold through the end of the week. If it doesn’t, the next leg lower could be more painful. Tighten stops for now, and hold a little extra cash.
Earnings eventually win. The trick is surviving until they do.
The Next Rotation: Technology vs. Healthcare?
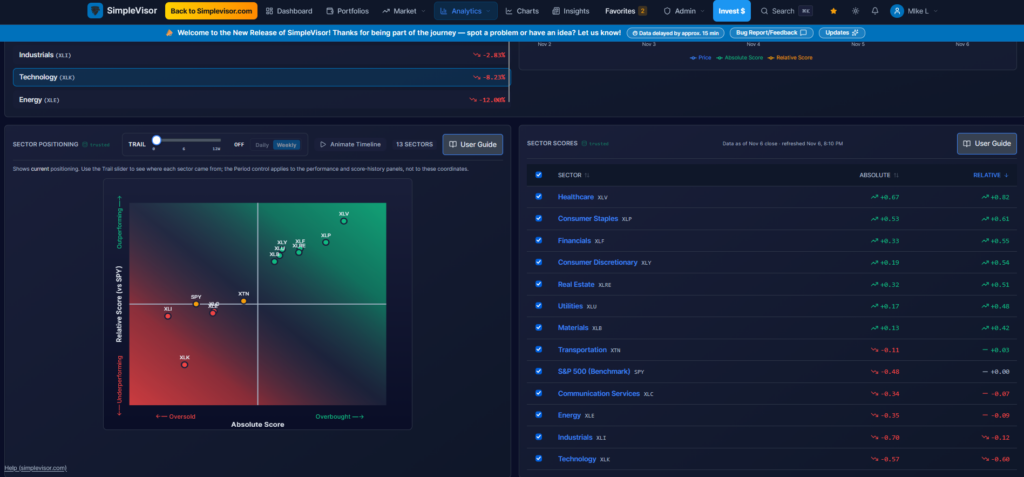
Often, our review of the sector and factor rotation scores focuses on the SimpleVisor analytics-rotation page as shown below. Today, we go deeper to help you see which sectors are likely to outperform or underperform going forward. The scatter plot and table show that the healthcare ETF (XLV) is the most overbought while technology (XLK) is the most oversold. While that is a good first clue that healthcare may trend lower in its absolute and relative scores, and vice versa for technology, what we want to know is whether they will do it at the same time.
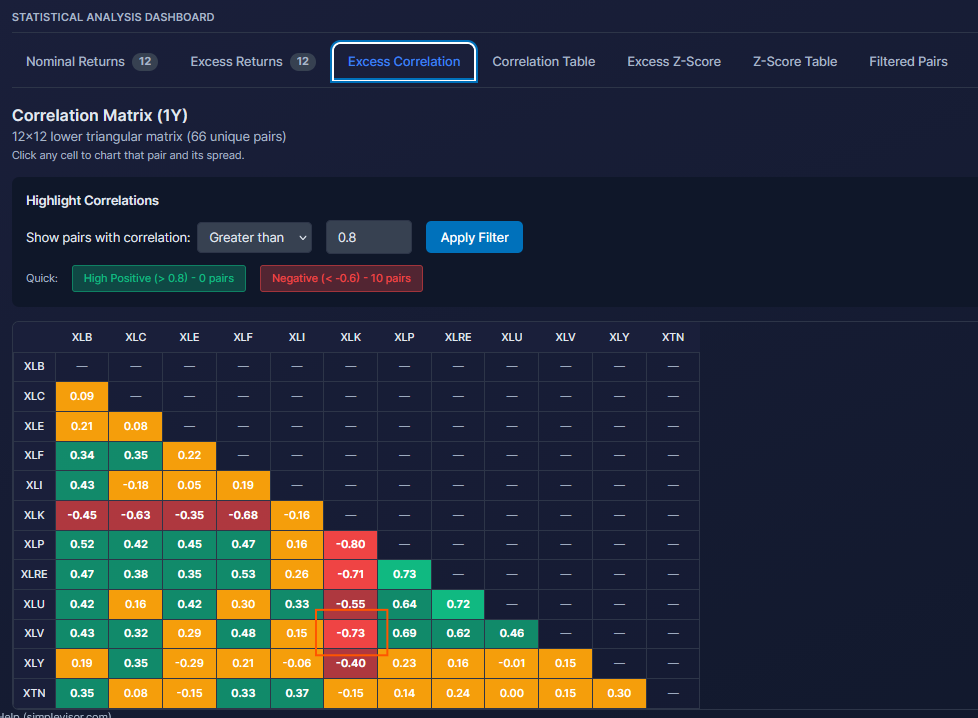
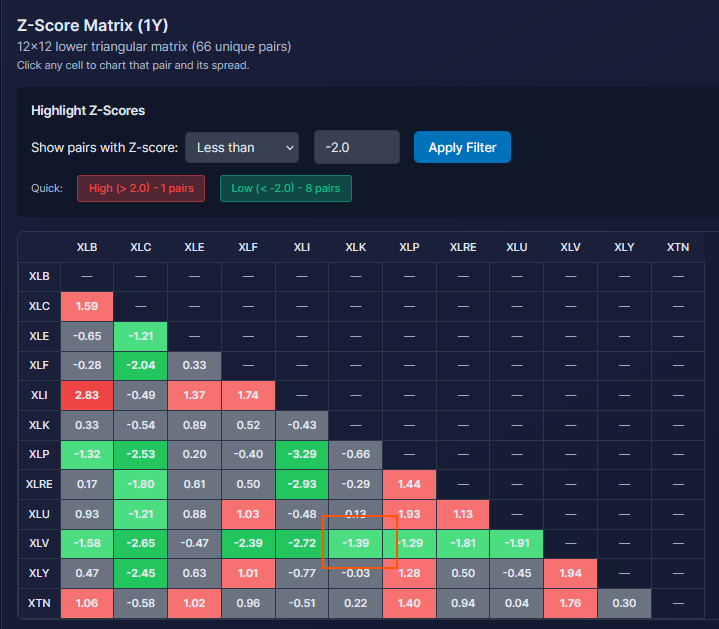
The second and third graphics help us assess that likelihood. The second graphic shows the correlation in excess returns between each sector. As we highlight, the correlation of excess returns ( versus the S&P 500) for XLV and XLK is -0.73. This indicates a strong statistical relationship: when one outperforms, the other underperforms. So, given this inverse relationship, we can look at the third graphic to see how stretched it is. While the distance between absolute and relative scores in the first graphic is very stretched, the third graphic doesn’t come to the same conclusion. It currently sits at 1.39 standard deviations from its norm. It is stretched, but as you can see, other relationships are much more stretched. All that said, we think technology has a good chance of outperforming, while many sectors in the upper-right quadrant underperform as we go into year-end. This was confirmed by our factor rotation model, which switched from value to growth last week.
How Bonds Work: Everything You Need To Know
Every few years, the financial media decides that bonds are “broken.” The headline usually follows a stretch where bond prices fell alongside stocks, and the conclusion is always the same: why own something that loses money when it is supposed to be “safe”?
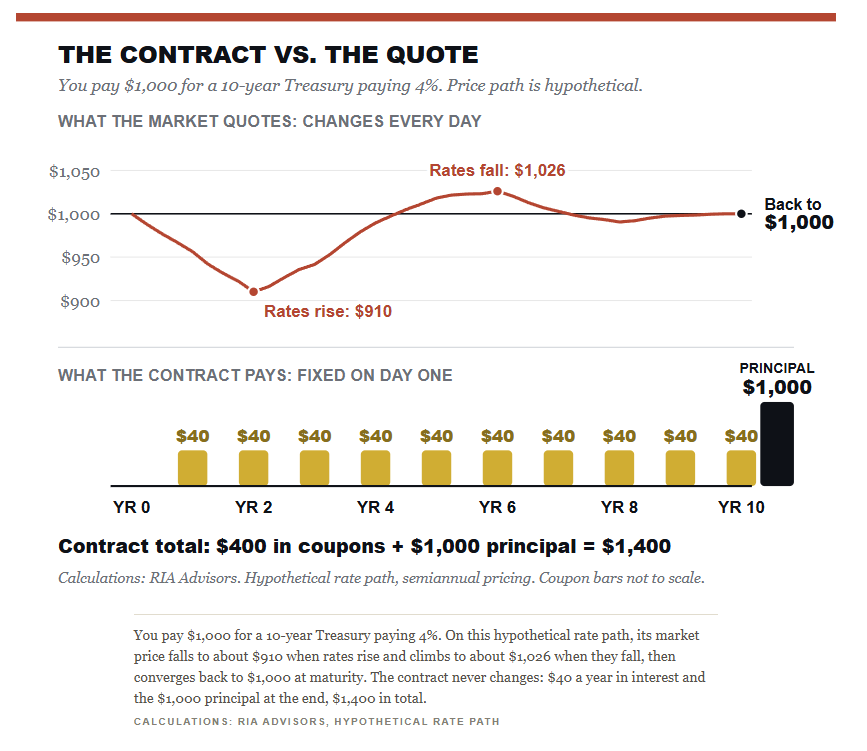
Here’s the problem with that argument. It judges a bond by the one number that matters least to its owner. Understanding how bonds work starts with a simple idea that most investors have never been taught. The price on your statement is a running estimate of what someone else would pay you today. It is NOT the amount the issuer has promised to pay you.
While that distinction may sound academic, wait until you watch what it does to investor behavior. For years, bond fund prices only went higher. However, the last 5 years have caused some pain for individuals, and with bond funds down 12%, their first inclination is to sell.
Of course, this is usually the point where investors sell near the low, then swear off bonds for a decade.
Tweet of the Day


Comments
Log in or sign up to join the conversation.