


Micron Technology (MU), the memory chip maker, generated $33.2 billion in adjusted FCF in its fiscal Q4, released on Sept. 30. That represents over 61% of its revenue, an extremely high FCF margin. For example, last quarter it was 42%.
These strong results and higher revenue forecasts from analysts have led to higher MU price targets (PTs). As a result, one attractive play for value investors is a put credit spread.
MU closed at $1,074.89 on Friday, Oct. 2, up from $1,065.11 on Sept. 30, and up 16.3% from a recent low of $924.03 on Sept. 14. However, analysts expect it to move substantially higher over the coming year.
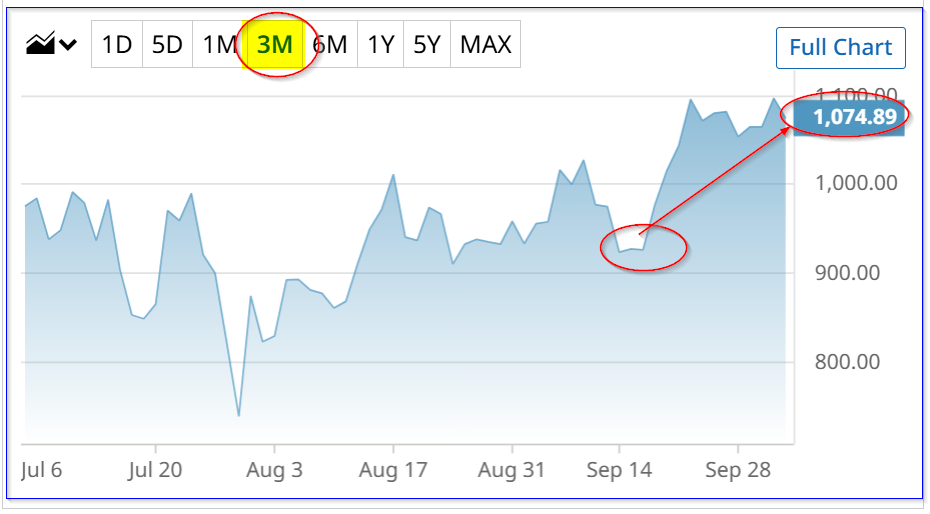
MU stock - last 3 months - Barchart - Oct. 2, 2026
Strong Results and Higher Forecasts
The bottom line is that analysts now project its Nov. 2027 revenue to hit $274.71 billion, more than double the $133.2 billion it reported for the year ending Sept. 4, 2026.
Moreover, that's 13.9% higher than the $241.8 billion analysts had forecasted as of three weeks ago. I discussed this in my Sept. 8 Barchart article, “Micron Price Targets Are Rising - Bull Put Credit Spreads in MU Are Attractive for Investors with Limited Funds.”
As a result, we can raise our FCF estimates and the resulting price target. For example, over the last year, Micron's adjusted FCF was $62.3 billion, representing 46.78% of TTM revenue.
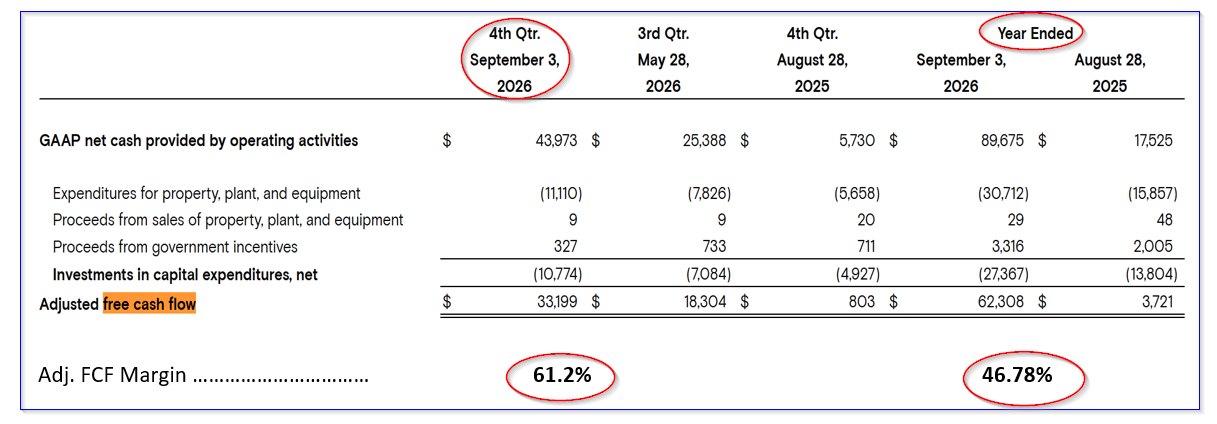
Micron's adj. FCF and margins - year ending Sept. 3, 2026 - from Sept. 30, 2026, earnings release and Hake analysis
That implies that the average FCF margin for the next year could be at least 54% of revenue (i.e., (61.2% + 46.78%)/2). That implies adj. FCF could rise to over $148 billion:
$274.71b revenue yr ending Aug. 2027 x 0.54 = $148.34 billion adj. FCF
That's 138% higher than its prior FCF of $62.3 billion. This implies MU stock's valuation should be substantially higher.
Higher Valuation and Price Targets
For example, using a 5% FCF yield metric, its historical average, Micron's fair market value (FMV) could be almost $3 trillion:
$148.34b adj. FCF / 0.05 = $2,967 billion FMV
That is 144% higher than its existing $1,214 billion market cap. This implies a PT of $2,623 per share. However, just to be conservative, let's assume the market gives MU a 7.5% FCF yield, i.e., 13.33 times adj. FCF:
$148.34b x 13.33 = $1,937 billion FMV, i.e., 59.6% higher
1.596 x $1,074.89 price = $1,715.52 PT
Analysts also have higher PTs. For example, Yahoo! Finance's average PT from 49 analysts is now $1,520.02, up from $1,513.11, as seen in my last Barchart article on Sept. 8. Similarly, Barchart's mean survey PT is now $1,528, up from $1,474.42.
The bottom line is that MU stock is worth substantially more as a result of its recent earnings release.
One way to play this, as I wrote in my last article, is to do a vertical put credit spread.
MU Put Credit Spread Worked Well
This is an attractive play because the returns are super leveraged. Moreover, the collateral requirement is very low, compared to doing a cash-secured short-put play. However, risks are also high.
Let's see how it worked out from my last Barchart article on Sept. 8. I discussed shorting the $950 put expiring Oct. 9 (i.e., 34 days to expiry) and buying at the same time the $930 put for the same period.
The net credit income collected was $797 since the $950 put had a $48.80 premium (credit) and the $930 put cost $40.83 (debit), for a net credit spread of $7.97.
Cut to Friday, Oct. 2, i.e., 24 days later. This play has been hugely successful, even more than the rise in MU stock.
The net credit spread is now lower at just $37.00, so the profit is $797-$37, or $760.00. That is because the midpoint premium for the $950 put $1.00, and the midpoint premium for the $930 put is $0.63 (i.e., $1.00-$0.63 = $0.37, or $37 per put contract).
Given that the investor only had to post $2,000 in collateral for this play, the net return (if it is closed out) is 38%:
$760 / $2,000 = 0.38, or 38% for 24 days.
Compare that to MU's rise during that period from $1,016.59 (Sept. 8) to $1,074.89 on Oct. 2, i.e., +5.73%. This shows that doing a put credit spread on a stock poised to move higher is a much better play.
However, keep in mind that investors stand to lose the $2,000 in collateral, so this is a higher risk of loss than owning MU.
New Put Credit Spread Play
Here is a new put credit spread worth investing in: For the period ending Nov. 6 (34 days to expiry), sell short the $1,000 put strike price for $31.25 and buy the $980 put for $24.78.
The net credit spread is $6.47 (i.e., $31.25-$24.78), or $647 (i.e., $6.47 x 100). Moreover, the collateral required is only $2,000 ($1000 - $980 x 100). (That's much lower than doing a cash-secured put at the $1,000 strike price, which would require $100,000 in collateral.)
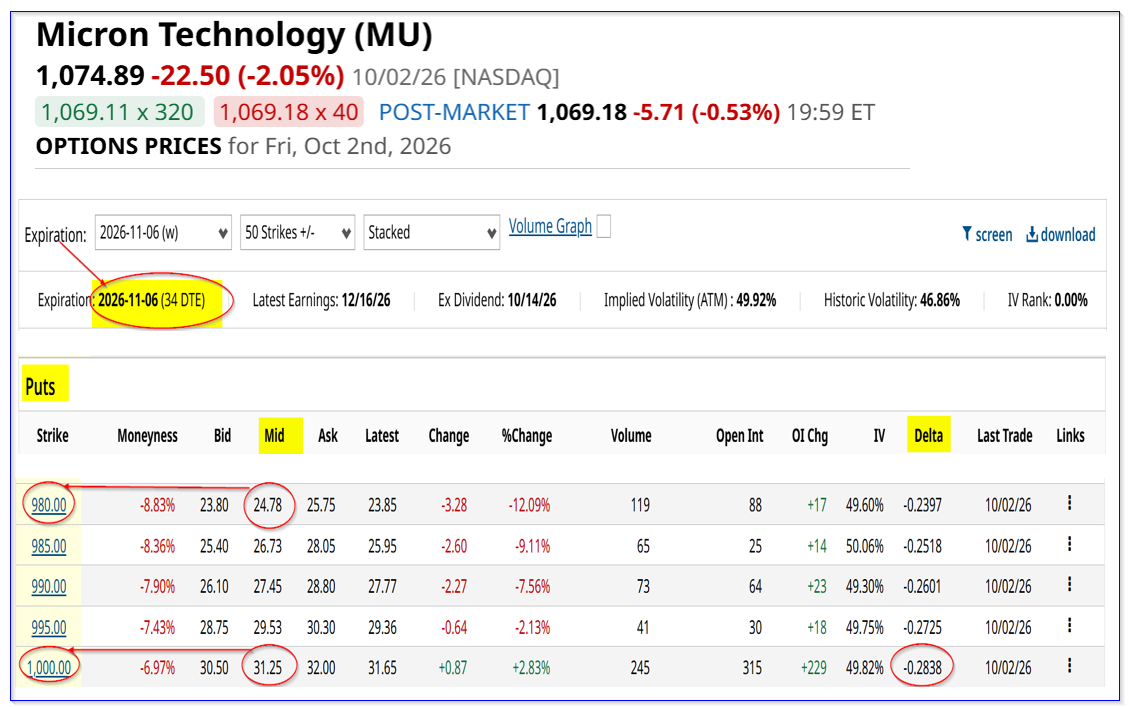
MU puts credit spread - put expiring Nov. 6 - Barchart - As of Oct. 2, 2026
That means the expected return (ER) is 32.35% (i.e., $647/$2000). And from an “at-risk” standpoint, given income already collected, the net ER is
$647/($2000 - $647) = $647/$1,353 = 47.8%
This is because even if MU falls below $930 by Nov. 6, the most the investor can lose is $1,353, not $2,000. Note, however, that the delta ratio is reasonably low at just -0.2838, implying a 71.62% chance of success.
The bottom line is that this is a very attractive, super-leveraged, albeit very risky, way to play MU stock.



Comments
Log in or sign up to join the conversation.