


The Mexican Peso is poised to depreciate over 1.20% against the US Dollar on Thursday, with the USD/MXN trading at 18.86. Expectations that the Federal Reserve would raise rates once more in 2026, along with US data supporting that view, weighed on the emerging market currency, which is poised to end the week with losses.
USD/MXN surges towards 19.00 as resilient US growth, high inflation pressures the Peso ahead of Mexico's GDP
On Wednesday, the Federal Reserve left rates unchanged, with Fed Chair Kevin Warsh remaining muted on forward guidance. Nevertheless, he revealed that there would be seven monetary policy decisions in 2027 and six in 2028.
The USD/MXN dipped near 18.60 on the decision and following Warsh remarks, but Thursday’s data triggered a recovery in the exotic pair.
Inflation in the US, as measured by the Core PCE, rose 3.1% in September, as expected, up from 3% in the prior month. Meanwhile, the US economy grew 3.4% YoY, above Q2 2026's 2.2% print and exceeding forecasts of 3.2%. All this data added up to a strong jobs report, as jobless claims for the week ending October 24 dipped from 195K to 194K, below forecasts of a rise to 199K.
Given the backdrop, money markets see a 76% chance the Fed will raise rates, well below the 84% expected a day ago, a sign that investors are less confident the Fed will raise interest rates.
In Mexico, the docket was absent, but the Bank of Mexico (Banxico) Deputy Governor Galia Borja noted that interest rates at 6.50% is a “good monetary position,” as inflation continues to dip to Banxico’s 3% goal. Despite recognising that inflation is moving in that direction, Borja emphasised that “the job is not yet done.”
On Friday, Mexico’s economic schedule will feature Gross Domestic Product (GDP) for Q3 2026, with the economy expected to grow 0.7% QoQ and, on an annual basis, to rise from 2.1% to 2.5%, according to economists.
USD/MXN Price Forecast: Technical outlook
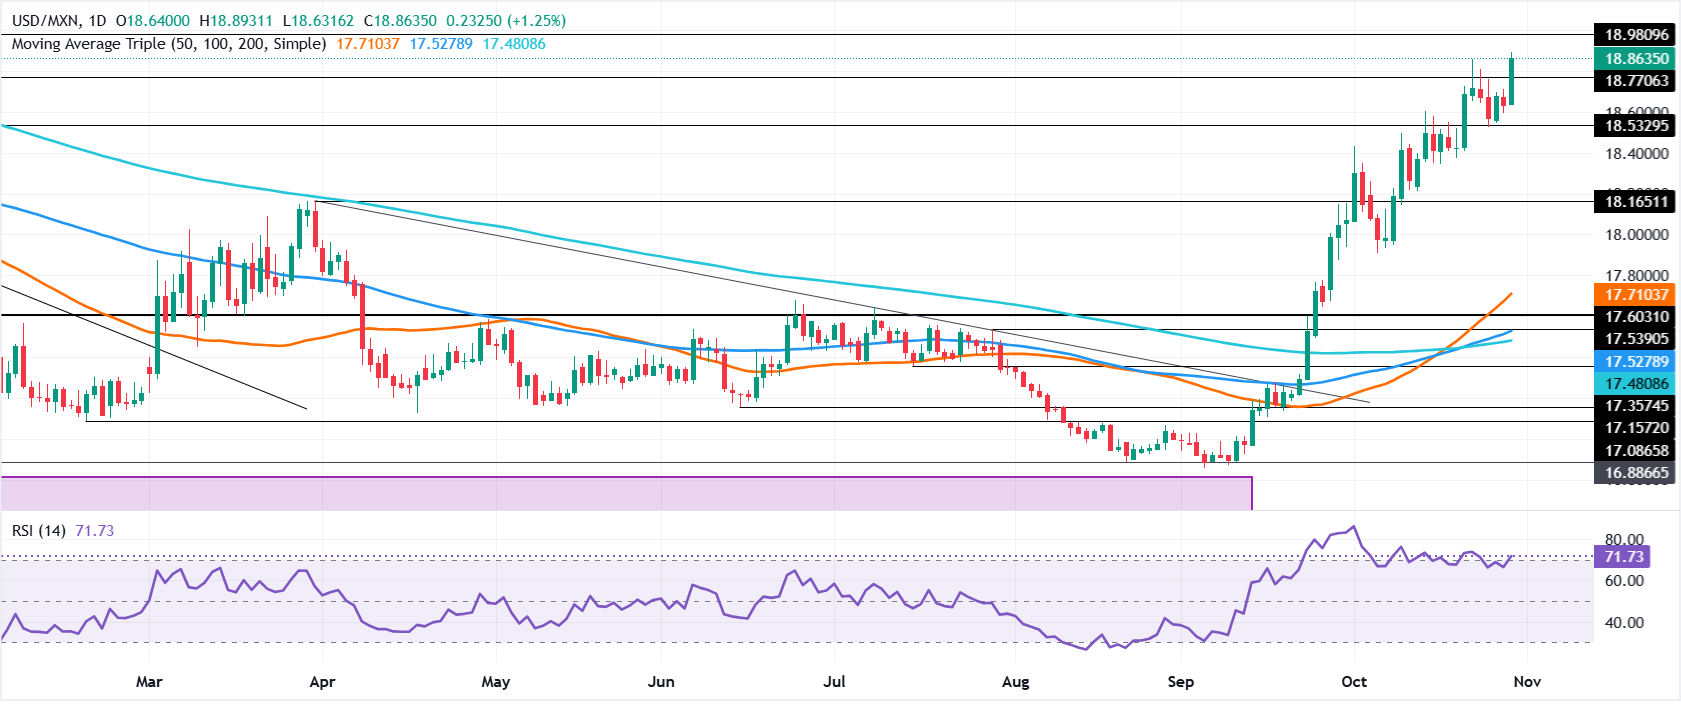
In the daily chart, USD/MXN trades at 18.8635, extending its bullish near-term bias as spot holds well above the triple simple moving average cluster around 17.7104. Price action is comfortably over the key structural floor at 16.8866, while the Relative Strength Index (14) near 71.7 pushes into overbought territory, hinting that the latest advance is stretched but still supported by firm underlying demand.
On the downside, initial support emerges at the grouped 50/100/200-day simple moving averages near 17.71, ahead of the more distant horizontal base at 16.89, where buyers would be expected to reassert control on deeper pullbacks. With no clearly defined resistance levels above the market in the current dataset, the pair remains in an uncharted topside phase, leaving any corrective phase likely driven first by overbought momentum rather than a well-established ceiling.



Comments
Log in or sign up to join the conversation.