


The Mexican Peso depreciated for the second straight day, down 0.16%, as the US Dollar held firm amid growing tensions in the Middle East and investor fears that mega tech companies are issuing more debt to finance the AI buildout. The USD/MXN trades at 18.72, up 0.20%.
The US Dollar boosted by the Middle East escalations
Sentiment soured as the US-Iran conflict escalates, with Washington and Jerusalem preparing plans to resume attacks on Iran after the US elections. Saudi Arabia and the Houthis exchanged attacks, igniting a jump in energy prices and, in consequence, driving the greenback higher.
Mexico VS US interest rate differential favours upside in USD/MXN
The USD/MXN resumed its uptrend as the Federal Reserve is expected to raise rates 25 bps towards the end of 2026. Conversely, the Bank of Mexico (Banxico) is foreseen to keep rates unchanged in 2026 and throughout 2027.
Mexico’s inflation rose above estimates in the first half of October, up from 3.42% to 3.62% in the period, exceeding forecasts of 3.60%, according to the national statistics agency, INEGI. Core inflation, which strips out volatile items like food and energy, dipped over the same period from 3.79% to 3.78%, missing forecasts of 3.70%.
US Initial Jobless Claims for the week ending October 17 came in better than expected at 194K, below both estimates and the previous reading of 200K, and fell to a near 57-year low. The four-week average also dipped to 197.75K, pointing to a low-hire, low-fire economy.
In the previous week, US inflation data on the consumer and producer side was higher than expected. This cemented the case that the Federal Reserve will at least increase interest rates once towards the end of the year.
Investors await Mexico’s October Retail Sales and Mid-Month Inflation data. In the US, the docket features jobless claims for the week ending October 17, S&P Global Flash PMIs, and the University of Michigan’s final October Consumer Sentiment reading.
USD/MXN Price Forecast: Technical outlook
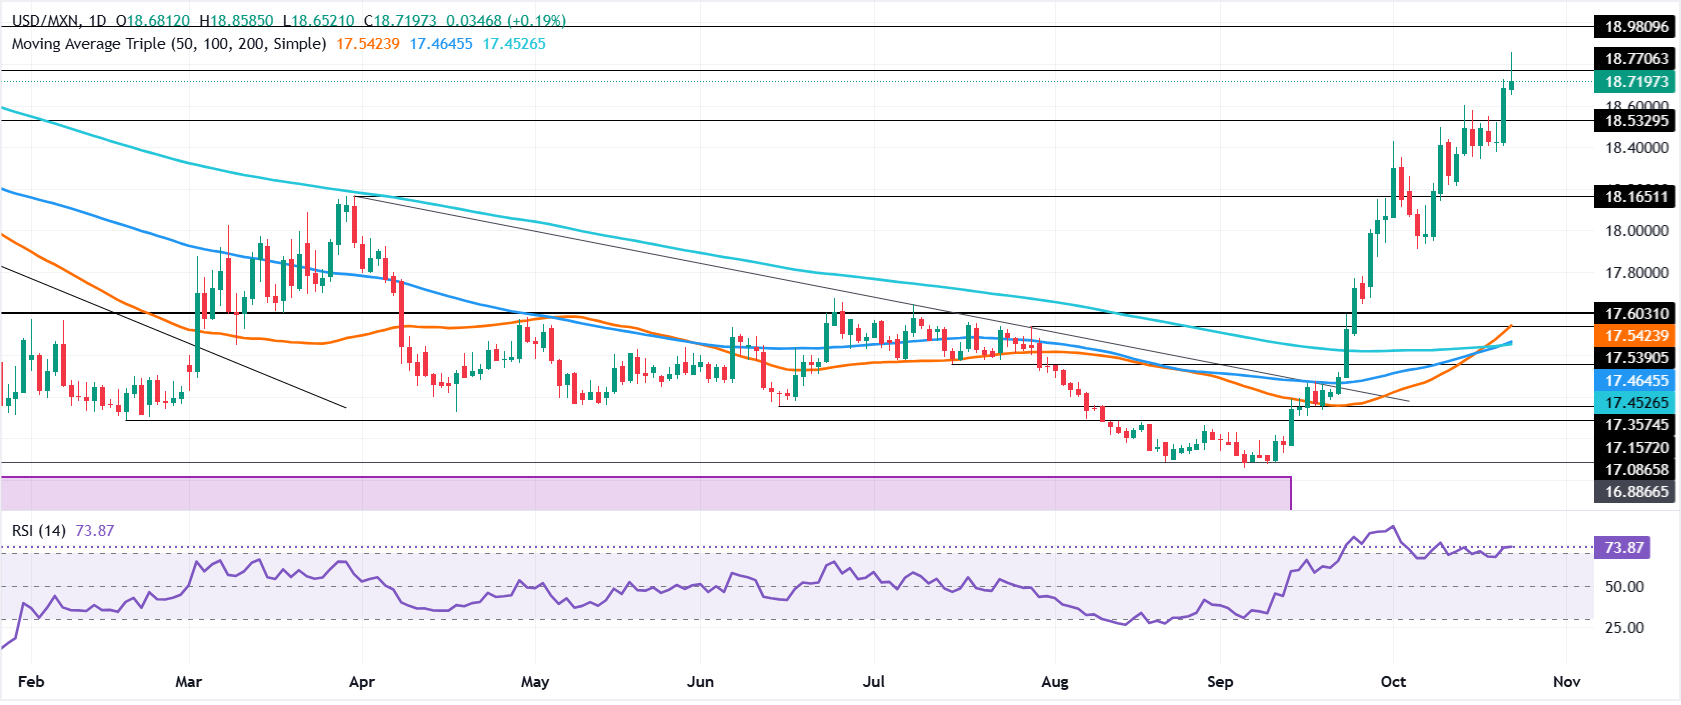
In the daily chart, USD/MXN trades at 18.7197, keeping a clear bullish bias as it holds well above the clustered 50-, 100- and 200-day simple moving averages (SMAs) around 17.54. The break higher extends the advance from the mid-16.00s while the Relative Strength Index (14) at 73.87 shows overbought conditions, suggesting upside momentum remains strong but stretched.
On the topside, the next notable resistance is the longer-term downward trend line projected from 21.0808, which caps the broader structure and could slow further gains. On the downside, initial support is seen at the 50/100/200-day SMA area near 17.54, ahead of the horizontal support level around 16.89, where buyers would be expected to re-emerge if a deeper correction unfolds.



Comments
Log in or sign up to join the conversation.