
In November of last year, we took a look at the performance spread between the equal and market cap-weighted versions of the S&P 500. The chart below provides an update through the end of September where positive readings indicate outperformance of the equal-weight S&P 500 and negative readings indicate outperformance of the market-cap-weighted index. In March 2020, as the market was plunging from the February peak and bottoming towards the end of the month, mega-caps such as Apple (AAPL), Microsoft (MSFT), Alphabet (GOOGL), Amazon (AMZN), and Facebook (FB) significantly outperformed the broader market, resulting in a 5.68 percentage point spread between the return of the equally weighted and market-cap-weighted S&P 500. Whereas the equal-weighted index declined 18.19% in March 2020, the market-cap-weighted index dropped ‘just’ 12.51%. In a reversal of these trends, the equal-weighted index outperformed between the months of September 2020 and March 2021, rallying 30.84% while its market-cap-weighted counterpart gained 18.14%. Over these months, there was a maximum monthly spread of 3.37 percentage points in favor of the equal-weighted index, which occurred last December. In recent months, mega-caps briefly took back the reins before the trend reversed in September when the equal-weighted index outperformed by 0.82 percentage points.

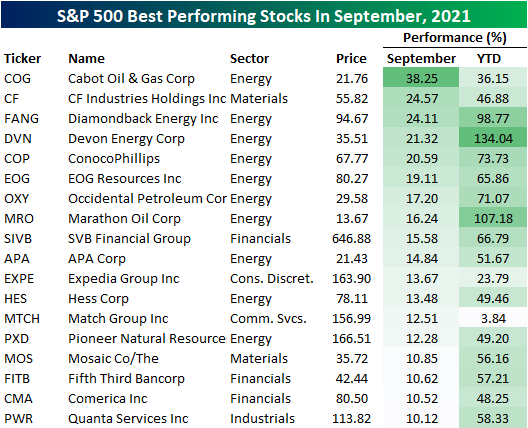
With the month of September behind us, the table below lists the 18 stocks in the S&P 500 that finished the month up over 10%, and less than a quarter of the stocks in the index (22%) finished the month higher. Overall, the average performance of stocks in the index was a decline of 3.7 percentage points. While short-term performance has been weak, on a YTD basis, 81.42% of S&P 500 stocks are up on the year, and the overall average gain is 18.90%. Of the stocks that have rallied 10%+ in September, more than half are from the Energy sector and another three come from the Financials sector.


Comments
Log in or sign up to join the conversation.