

A new short-term downtrend began on Wednesday, June 16 with the PMO turning lower. I should say "finally" turning lower because the choppy sideways pattern of the PMO seemed to go on for a long time. It wasn't too surprising when it resolved to the downside because moving sideways like that is unusual and served as a bearish signal by not confirming the rise of the SPX off the lows of late May.

The SPX closed beneath its five-day average on Wednesday, and the selling in this session was a signal to lighten up. The weakness on Wednesday was telling because it followed two strong days on Friday, June 11 and Monday, June 14, and it felt to me like a sharp reversal of the trend. In addition, individual stock breakouts were not following through and undercutting their breakout levels in some cases.

The red candle shown in the 10-day Call/Put ratio on Friday, June 11 hinted that the short-term trend was weakening after showing a very strong uptrend beginning mid-May.

The bullish percents of the NYSE and SPX also hinted at some weakness and were sending bearish warnings by not confirming the major indexes. The warning from the SPX bullish percent was early as it started rolling over at the beginning of this month.

While the indicators in the charts above were sending bearish warnings, the number of new 52-week lows was not. I think this means that the risk of a major selloff is low. As Mike Burk often states, nothing really bad happens to the major stock market indexes unless there is a significant rise in the level of new 52-week lows.
Be sure to watch this chart every day because the number of new lows can spike up very quickly. Also, this is a tricky indicator to use because a spike in new lows can be either a serious warning for the market, or it can be an indication that selling pressure has peaked and the market is getting ready to start moving higher again. This is one reason why I always raise some cash near the top of the short-term cycle. When new lows start to spike, it feels way too late to be selling.

The new lows shown above suggest that there isn't much risk of major selling, but the chart below is saying that the market may be ready for some selling that is more than just a short-term pullback in prices.
The weekly NYSE common-stock-only cumulative advance-decline chart is signaling that it is ready to move lower, and this often means there is a medium-term downtrend in the works. At the moment, I would be prepared for at least a selloff similar to the September and October period of last year.

On Wednesday, when the Fed announced that it planned to raise rates earlier than expected, bond yields spiked higher. But then on Thursday and Friday, they went back down and now look like they are confirming the downtrend. That was confusing. But then again, it isn't unusual for the markets to need a few days to settle into new trends after a big event or announcement.
With yields headed lower, we now have rotation out of inflation and rate-sensitive sectors, and back into technology. This is a whipsaw that feels like whiplash. Some people choose to handle this by diversifying and holding all sectors to smooth things out, but other people, like me, just sell or trim the weak holdings and buy or add to the strong holdings. That's my style and I'm sticking with it, even if it results in more trading activity than I would like.
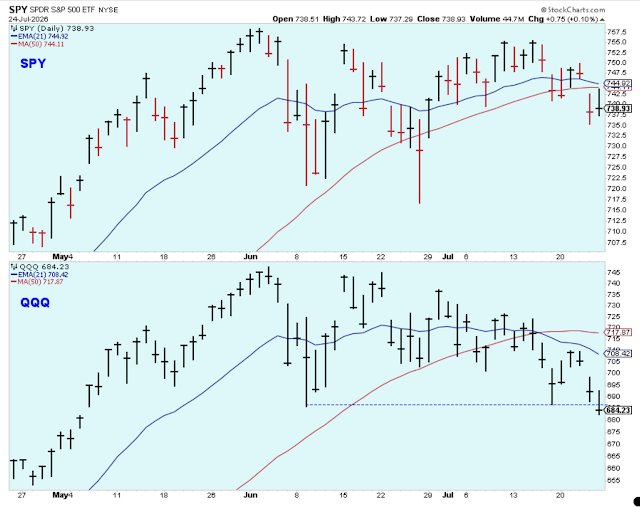
The question now is, will the new short-term downtrend in the market pull down the leading technology stocks that have just started to rally? My guess is that yes it will, so I am prepared for that with plenty of cash and small positions. My thinking is that after the huge rally last year, and the difficult market so far this year, we need to respect risk.

The guests on CNBC noticed the rising dollar this week. In my opinion, this is risk-off market behavior and thus favors caution towards the market.

Sentiment is still too bullish. The market needs to flush out these bulls so it can move higher. Look for the number of bulls to dip below 50 in order for sentiment to begin to favor stock prices from a contrarian point-of-view.

Bottom line: Respect the risk that stock market prices will move lower.
Outlook Summary
- The short-term trend is down for stock prices as of June 16 (change in trend).
- Contrarian sentiment is unfavorable for stock prices as of Nov. 14.
- The economy is in expansion as of Sept. 19.
- The medium-term trend is up for treasury bond prices as of June 11 (prices higher, rates lower).


Comments
Log in or sign up to join the conversation.