


McDonald’s (MCD) enters the final months of 2026 with weaker U.S. traffic and cautious lower-income consumers. U.S. comparable sales rose only 0.8% during the second quarter, falling below expectations. However, analysts still expect 2026 revenue near $28.17 billion, about 4.8% above 2025. Analyst views remain mixed, with Morgan Stanley at Equal-Weight and BTIG maintaining Buy.
Meanwhile, McDonald’s is advancing its NEXT strategy to improve food quality, hospitality, and restaurant efficiency. The company still plans about 2,600 restaurant openings globally during 2026. Additionally, McDonald’s raised its quarterly dividend 4% to $1.93 per share on September 17. Investors will now focus on the September 23 Investor Day for new financial targets and growth details. These developments could shape MCD’s fundamental outlook through year-end.
Elliott Wave Outlook: McDonald’s MCD Weekly Chart July 2026
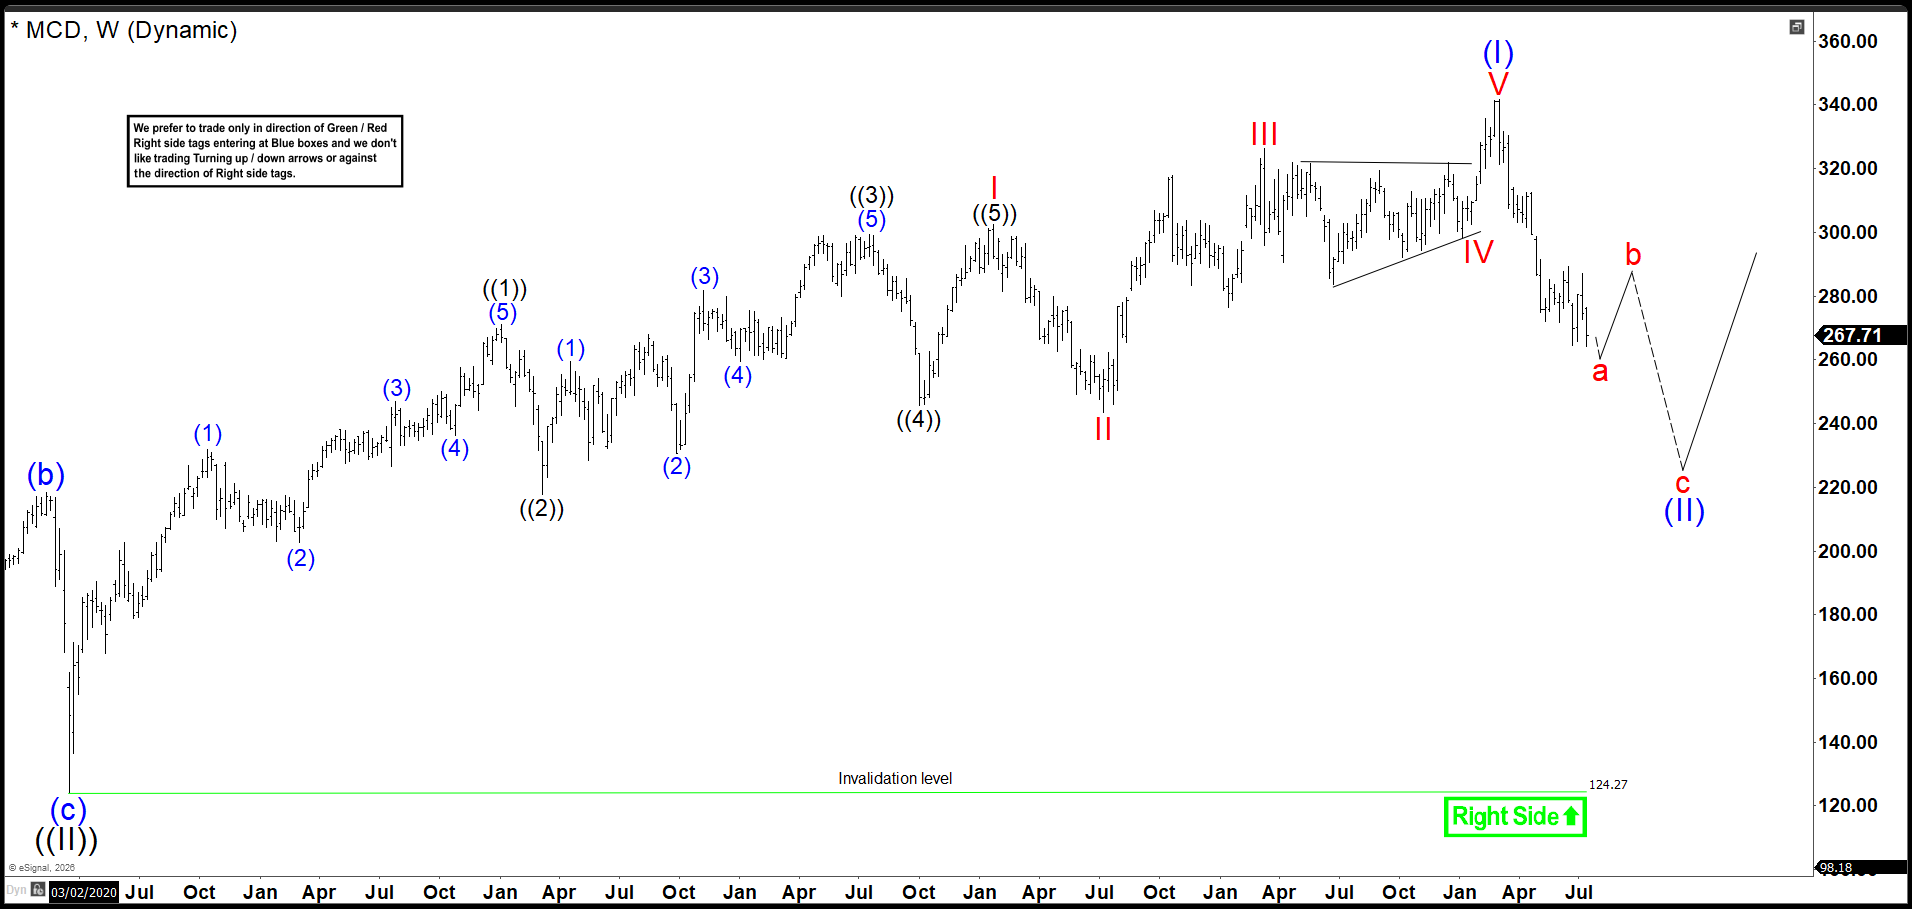
In our previous update, we expected MCD to be correcting the entire cycle from the 2020 low. As the decline continued to extend, we removed the triple nest and relabeled the advance as a leading diagonal in wave (I).
From there, we expected a rebound to develop in wave b before failing, opening the door for wave c of (II) to continue lower. We identified the 259.00–207.56 area as the main downside target for the correction. Once that area is reached, we expected buyers to appear and potentially resume the broader bullish trend, which would confirm that wave (II) had completed and the larger upside cycle was ready to continue.
Elliott Wave Principle Behind the Market Structure
Impulse
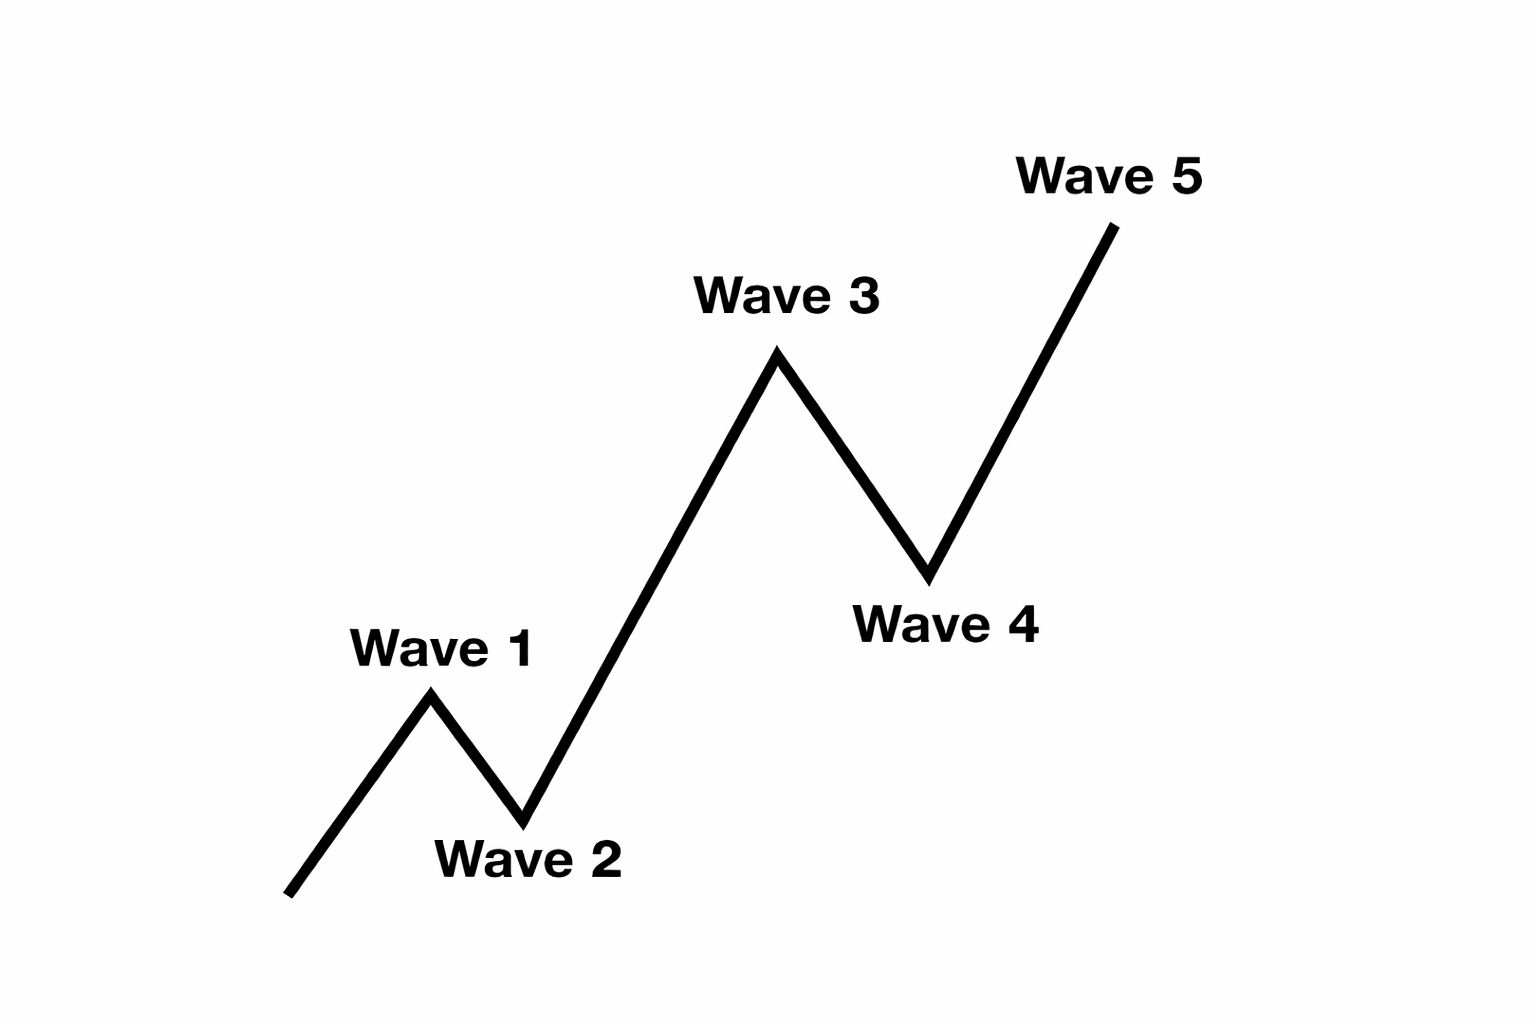
An impulse is a clean 5‑wave pattern that drives the trend forward.
Waves 1‑3‑5 are strong and directional.
No overlap between waves 1 and 4.
Wave 3 is usually the strongest.
Structure is clear, with increasing momentum.
Elliott Wave Outlook: McDonald’s MCD Weekly Chart September 2026
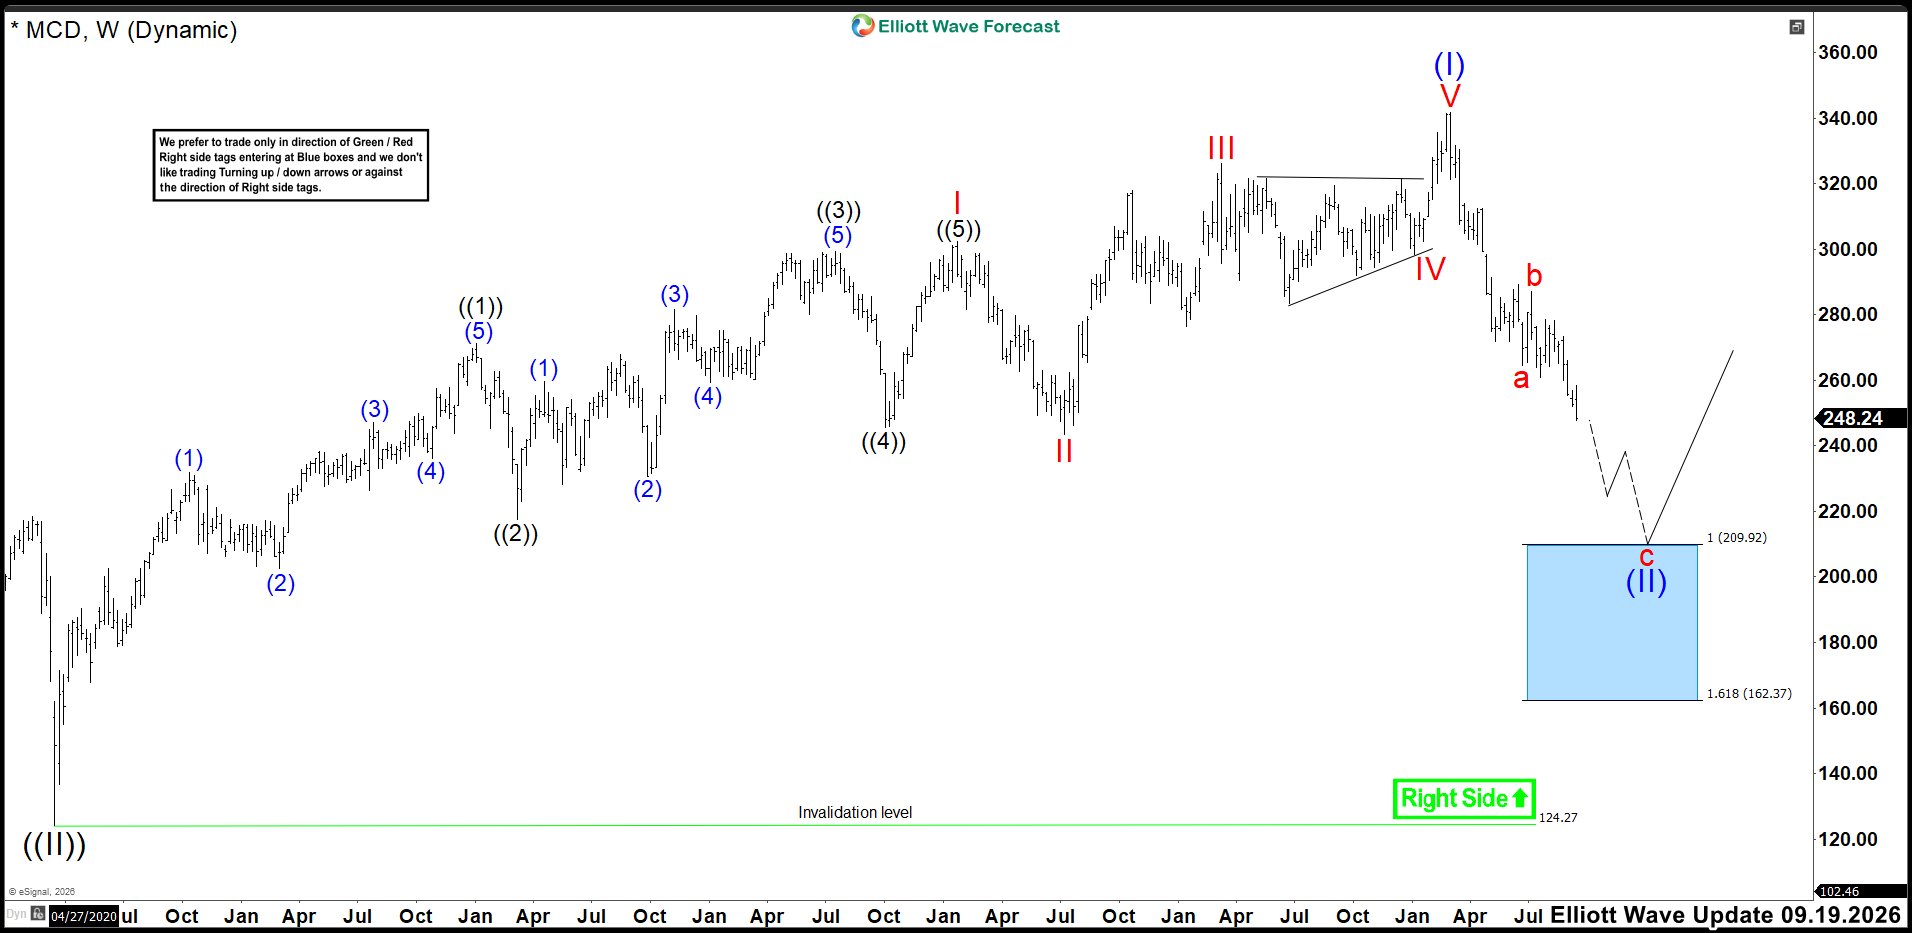
MCD has now confirmed a correction of the entire bullish cycle that started from the March 2020 COVID-era low and ended at the latest all-time high. The decline from wave (I) appears to be developing as an A-B-C correction in wave (II). Waves a and b are already in place, while wave c continues extending lower. The next major target sits near the 209.92–162.37 Blue Box area, where the correction could complete before the larger bullish trend resumes.
Therefore, a buy limit near $210 could offer an attractive opportunity to position for a potential rebound. This level marks the upper boundary of the Blue Box and an important Fibonacci extension area. Buyers could begin appearing there as wave c of (II) approaches completion. A strong reaction from this zone would support the view that MCD is preparing for another major advance. However, the broader bullish structure remains valid while the 124.27 March 2020 low stays intact.



Comments
Log in or sign up to join the conversation.