


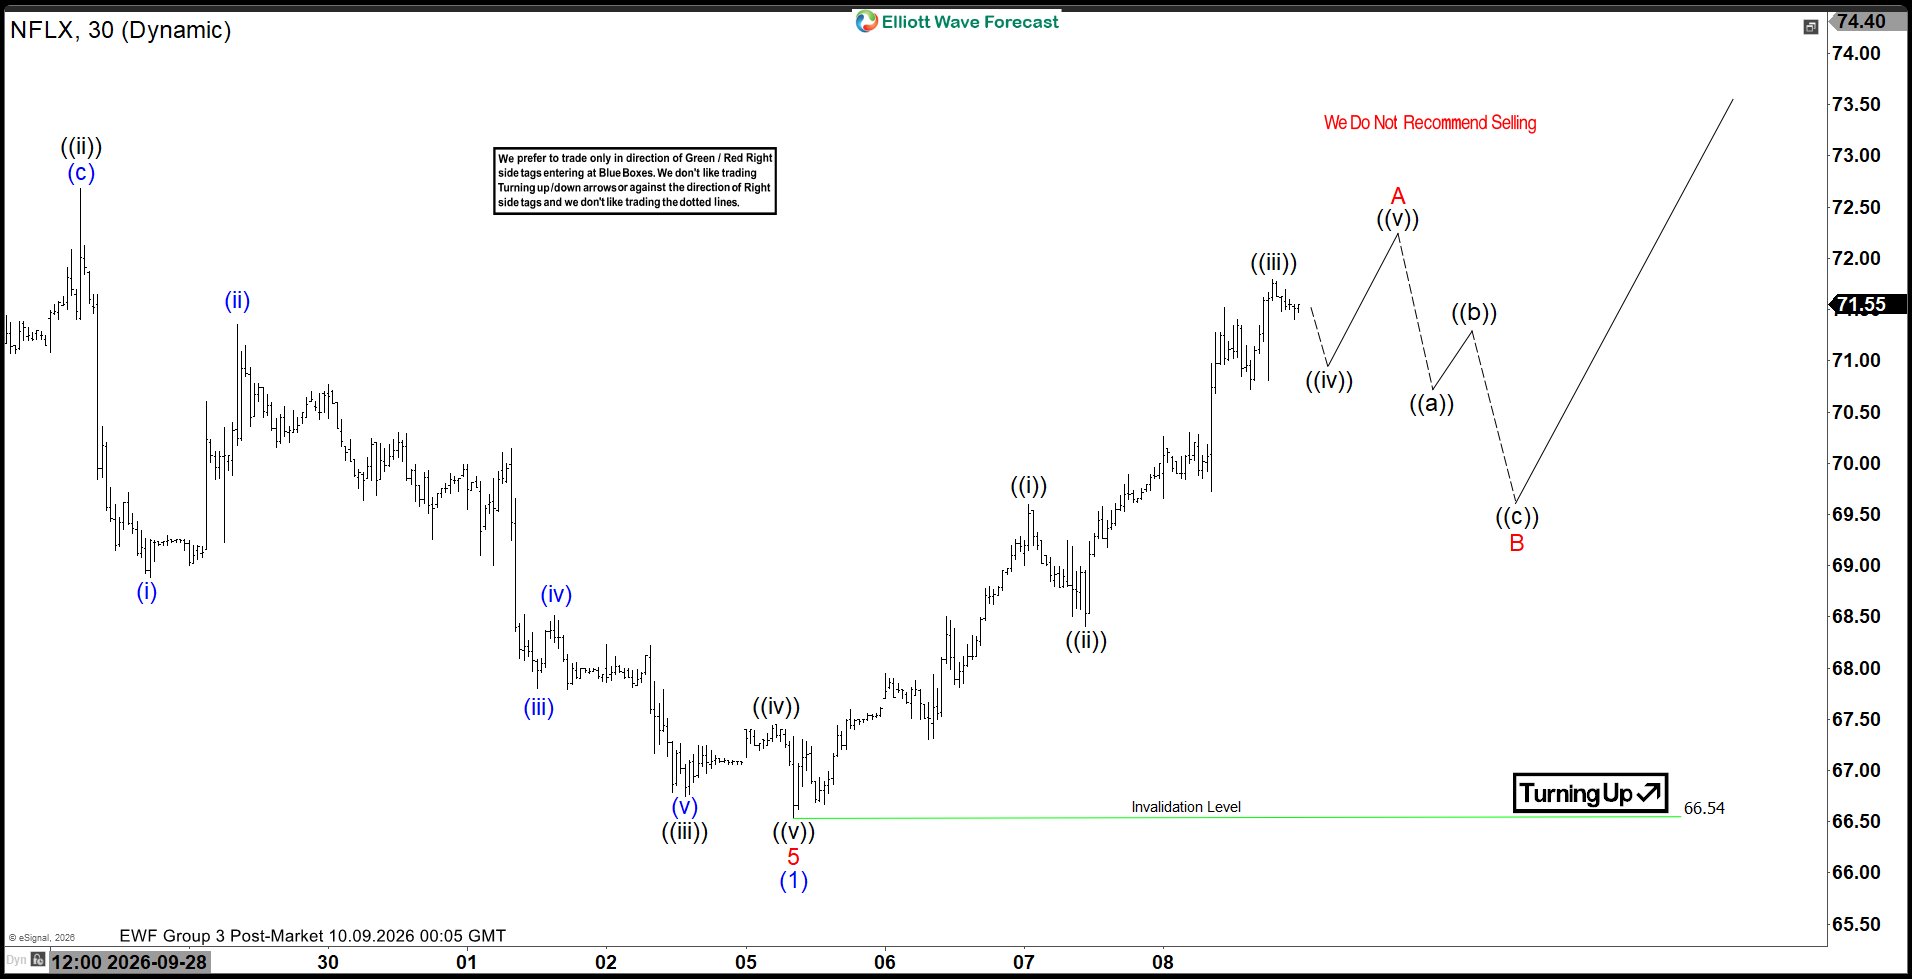
Netflix (NFLX) has sustained a bearish Elliott Wave sequence since reaching its all‑time high of $134.12 on June 30, 2025. The sequence points to potential downside risk toward the $49.78–$35.8 zone before a major bottom develops. In the near term, the cycle from the September 3, 2026 peak ended with a five‑wave decline, completing wave (1) at $66.54. A corrective rally in wave (2) is now unfolding. It is retracing the cycle from that September high in either three or seven swings before the larger decline resumes. The internal structure of wave (2) is expected to unfold as a zigzag, with wave A advancing in five waves.
From the wave (1) low, wave ((i)) finished at $69.6. A pullback in wave ((ii)) ended at $68.41. The stock then moved higher in wave ((iii)) toward $71.80. A modest retracement in wave ((iv)) is anticipated before another advance in wave ((v)) completes wave A. Once wave A concludes, the market should correct lower in wave B. That move will address the cycle from the October 5, 2026 low. Afterward, the stock is expected to turn higher again in wave C of (2).
As long as the pivot at $66.54 remains intact, pullbacks should find support in either three or seven swings. This structure allows for near‑term strength within the corrective rally. The broader bearish sequence, however, continues to signal lower levels before a lasting bottom emerges.
Netflix (NFLX) 30 Minute Elliott Wave Chart



Comments
Log in or sign up to join the conversation.