

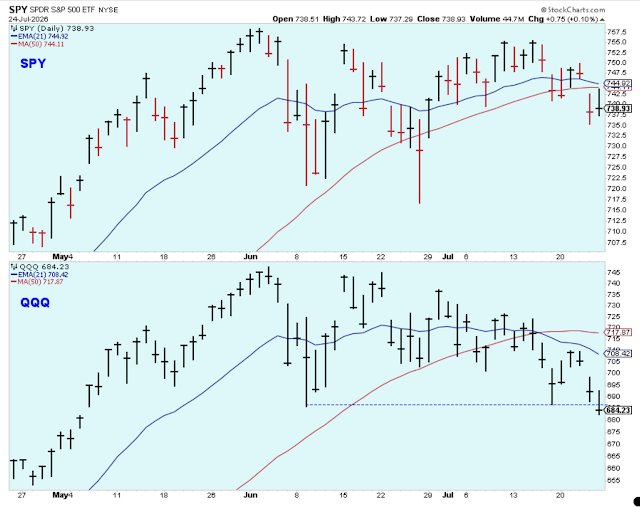
The short-term uptrend continues, but the market is hinting that short-term momentum is weakening and that a new short-term downtrend is likely soon.

The SPX started trading under its five-day average on Wednesday. Trading under the five-day is the first step in a new short-term downtrend and a close under SPX 3535 would probably be confirmation.

The PMO momentum indicator for the broader market index has already started to turn lower for the intraday time period.

The 10-day Call/Put ratio has stalled. One or two solid red bars would be another downtrend confirmation.

The Stochastic is at the top of the range.

The Buy-Write index is starting to turn lower.

These charts are evidence that the short-term trend has weakened, but still not enough to say that the trend is now pointing lower. We've seen plenty of time periods in the past where momentum and breadth struggled, but then surprised us by turning higher based on market-impacting news. I could see that happening now.
Traders were torn between good news and bad this past week resulting in challenging price action. So many charts showed attractive price setups but then didn't result in big breakouts. Not yet anyway.
I do best when I stick to my basic trading strategy and avoid over-thinking the market, so I am sticking to my basic trading strategy. With the PMO index at the top of the range for two weeks, and with momentum waning a bit, I have raised my cash level to about 15% by trimming laggards and taking partial profits.
By raising cash when the market is at the top of the short-term range, I am much less likely to panic and sell when the market inevitably pulls back and is at the bottom of the short-term range. Also, it means I have cash available to add to winners at lower prices and to buy the stocks breaking out of healthy bases.
The Longer-Term Outlook
The M2 money supply growth remains healthy which favors higher stock prices longer term.

Here is a 10-year weekly chart that shows how the money supply has been accelerated this year to help with the economic crisis.

The ECRI Leading Economic Index just keeps climbing. There is no sign of weakness here despite Covid-related economic stress. This index favors strength in the economy and favors higher stock prices longer-term.

The Investor's Intelligence Newsletter Writer's Sentiment Survey indicates too many bulls, and this works against stock prices from a contrarian point-of-view.
Using this sentiment indicator to help trade stocks can be tricky because in my experience this is a medium-term indicator, and I find it harder to help time stock prices. This indicator tells me not to take any large risks right now and to have a bit more cash in the account than usual.

Outlook Summary

The short-term trend is up for stock prices as of Nov. 3
Contrarian sentiment is unfavorable for stock prices as of Nov.14
The economy is in expansion as of Sept.19
The medium-term trend for treasury bonds is down as of Oct.10 (prices lower, yields higher)
Strategy During a Bull Market
- Buy large-cap stocks and ETFs at the lows of the medium or short-term market trends
- Buy small-cap growth-stocks on breaks to new highs in the early stages of market trends
- Reduce buying when the market trend is at the top of the range
- Take partial profits when the market uptrend starts to struggle at the highs
Trader Discipline
- Don't be afraid of corrections because they are opportunities
- Never invest based on personal politics
- Take pride in sticking to the trading plan
- Don't give in to fear, greed, or anger


Comments
Log in or sign up to join the conversation.