

The Short-Term Trend
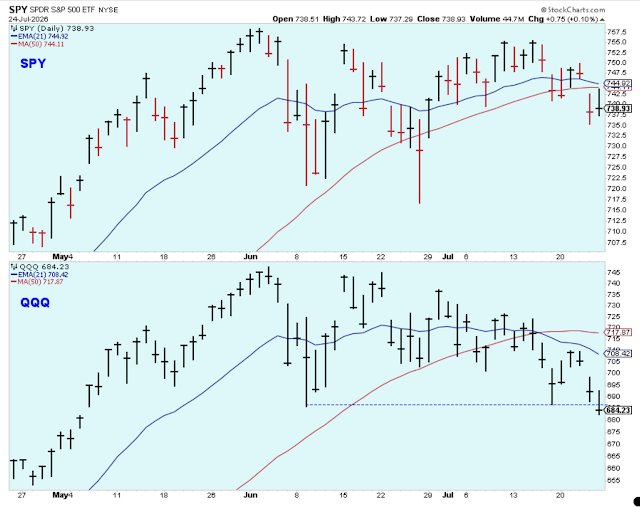
The market flipped to a short-term downtrend on Monday, October 26, with the majority of stocks showing weakness according to the PMO index. However, the major indexes provided plenty of warning of a potential downtrend when they started to trade under the five-day average way back in the second week of October. That was the signal to start to lighten up.
It was pointed out to me that four years ago, the market bottomed on the Friday before the election and that could be what we are seeing now. Friday was mixed with some stocks starting to show strength, while others continued to get hit hard.
As you can see, the PMO stalled on Friday and didn't reach the bottom of its range, which may be a tiny hint that the market is getting ready for the post-election period and also for the strong seasonal period for stocks in November. And, of course, people want to have plenty of cash available in case there is a contested election, or violence, or possibly something else that we can't anticipate.

Here is a look at the five-day average that I mentioned, and it really looks like the large-cap stocks in the SPX went into a downtrend two weeks before the broad market did this past Monday. The SPX has found a support level just above the September lows, and confirmation of the next uptrend will be a break above the 3340-level.

Ordinarily, I would say that we should wait a week or so while the market bottoms out and then look for hints from the technical indicators that the next short-term uptrend is beginning. However, with the election coming on Tuesday, we need to be watching much more closely and be ready for any outcome.
During most serious market selloffs, the level of new 52-week lows pops up above normal levels. If the increase in new lows occurs while the market is rising or near the top of the PMO range, then it is a dangerous signal for stocks and it is time to get defensive. But if the new lows increase while the market has been selling off and the PMO is near the bottom of the range, then it is often a signal the selling is washing out the excessive bullishness and that a short-term bottom is near. In this case, I think it is the latter.
With new lows at excessive levels, a really good signal to re-deploy cash into stocks is when we see a dramatic decrease in new lows. It is the signal that the dark clouds have finally given way to blue skies. You have to decide for yourself how you will trade stocks in the coming week, but for me, when these new lows drop down to harmless levels, I will get aggressive.

The Longer-Term Outlook
The money supply continues to grow nicely, which favors higher stock prices longer-term.

The ECRI index followed up on last week's accelerated increase with another pop to the upside. This indicator is signaling global economic growth. After years of watching this index, I know better than to bet against the economy while it is rising.
Of course, the recent surge in COVID-19 cases is disturbing and it is probably too early to expect the negative impact to be reflected in this indicator. So, again, you have to decide for yourself, but I am not going to bet against the economy while this indicator is moving higher.

The ECRI has stated that their inflation gauge started rising about five months ago and that they believe the trend is now higher for inflation. I am taking their comments seriously, and my trading and investments need to reflect the rising inflation. In my view, it means high PE stocks, such as technology, now have a headwind and inflation-sensitive and rate-sensitive stocks have a tailwind. Materials, miners, industrials, and financials will probably start to appear more frequently on the list of new highs.
The new year is around the corner, and it is my tradition to try and add something new each year to my trading style. My goal this coming year is to add more rigor to my rule-based trading system.
First, when a stock or ETF that I own generates a buy or sell signal, the rule is that I have to act on it even if it means I only add or trim by a small dollar amount. No exceptions. I don't have much of a problem adding when I have a buy signal, but trimming when there is a sell signal is more difficult. This past month serves as a good example.
Second, I have specific targets for the cash in my accounts, and when my short-term market signals start to flash, I have to change the cash portion as the market indicates. For instance, when a short-term uptrend starts to struggle, I have to have at least 5% of the accounts in cash.
There can be more than 5%, but it should be at least 5%. And, when the market signals that it is time to buy, I then have to deploy the cash aggressively. There will be occasions when the buy signal is wrong, but they are actually much less frequent than you may think, and the real mistake is usually at the cost of the opportunity.
Outlook Summary
- The short-term trend is down for stock prices as of October 26.
- Contrarian sentiment favors higher stock prices as of October 1.
- The economy is in expansion as of September 19.
- The medium-term trend for treasury bonds is down as of October 10 (prices lower, yields higher).


Comments
Log in or sign up to join the conversation.