
Nominal and real yields rise, as do inflation breakevens, while yield curve flattens.
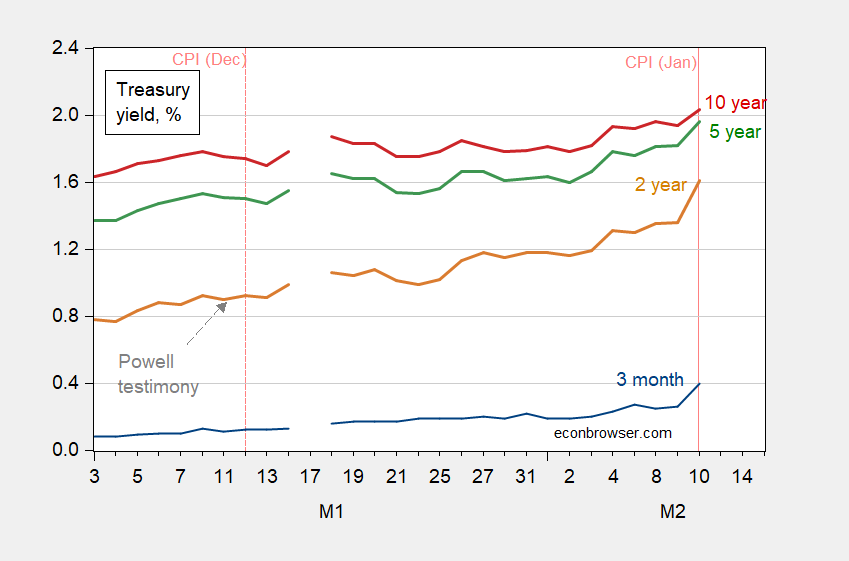
Figure 1: Treasury 3 month yield (blue), 2 year yield (brown), 5 year yield (green), and 10 year yield (red), all in %. Pink dashed lines at CPI release dates. Source: Treasury via FRED.
The sharp jump in yields particularly between 3 months and 2 years suggests a faster increase in short rates than previously anticipated by the market.
At the same time, real rates are rising, as measured by TIPS yields (which recall incorporate liquidity premia).
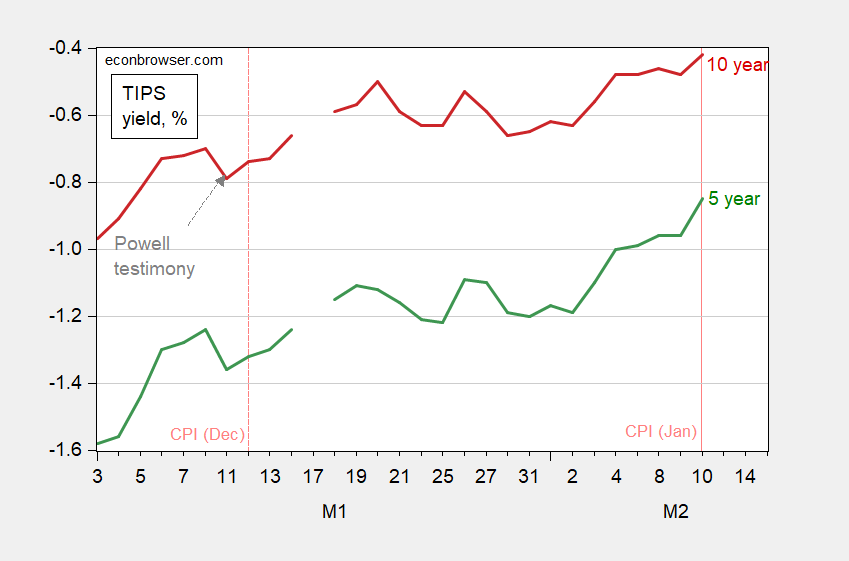
Figure 2: TIPS 5 year yield (green), and 10 year yield (red), all in %. Pink dashed lines at CPI release dates. Source: Treasury via FRED.
Implied expected inflation over the next five years — both current and for five years from now — increased, by 3 bps.
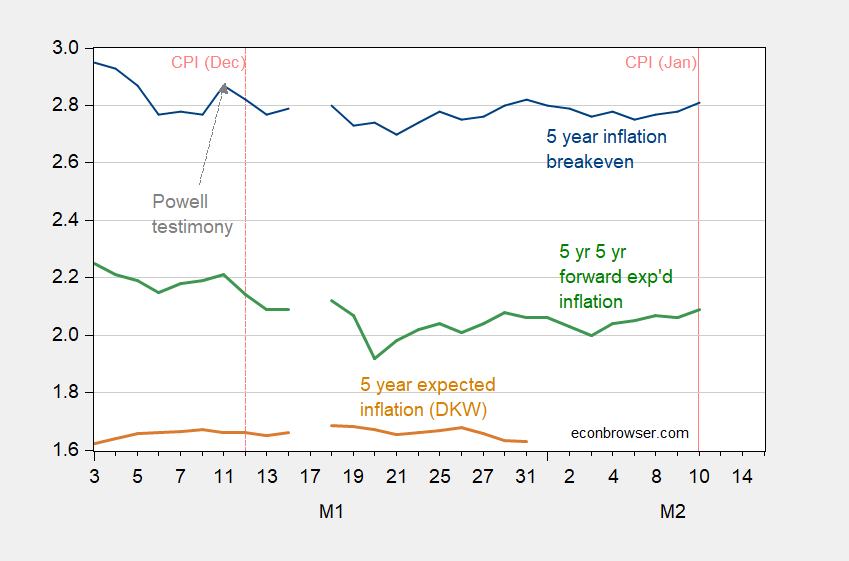
Figure 3: Five year inflation breakeven calculated using 5 year Treasury minus 5 year TIPS yields (blue), five year expected inflation (brown), and five year five year forward inflation breakeven (green). Pink dashed lines at CPI release dates. Source: Treasury via FRED, Kim, Walsh and Wei (2019) following D’amico, Kim and Wei (DKW) accessed 2/10/2022, and author’s calculations.
Given how estimated expected inflation after accounting for risk and liquidity premia(per Kim, Walsh and Wei) differ from the unadjusted inflation breakevens, one has to be cautious about making inferences from these movements, particularly such small ones.
Finally, even with the long yield rising, the term spread shrank by 5 bps.
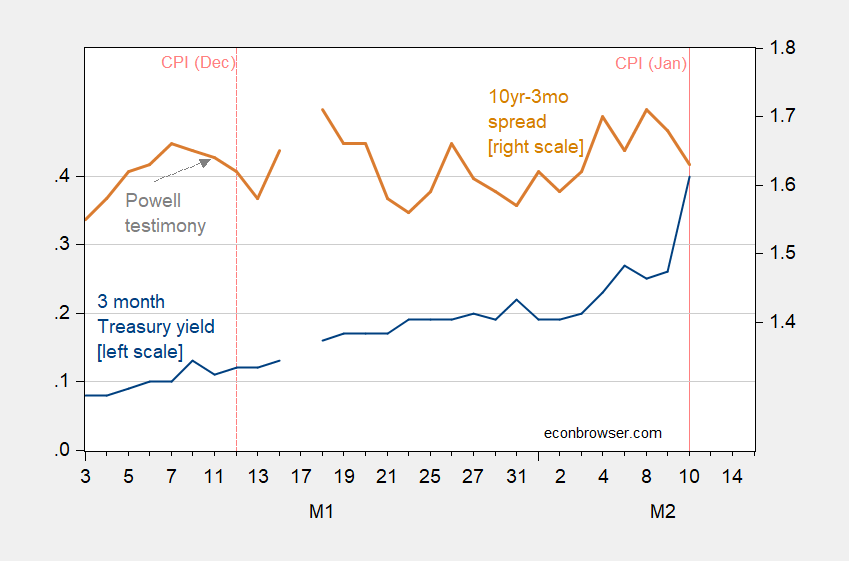
Figure 4: Treasury 3 month yield (blue, left scale), 10 year – 3 month spread (brown, right scale), all in %. Pink dashed lines at CPI release dates. Source: Treasury via FRED, and author’s calculations.
While this yield curve flattening suggests market expectations of deceleration, it needs to be kept in perspective. The current spread is about the same as it was in March of 2021.


Comments
Log in or sign up to join the conversation.