

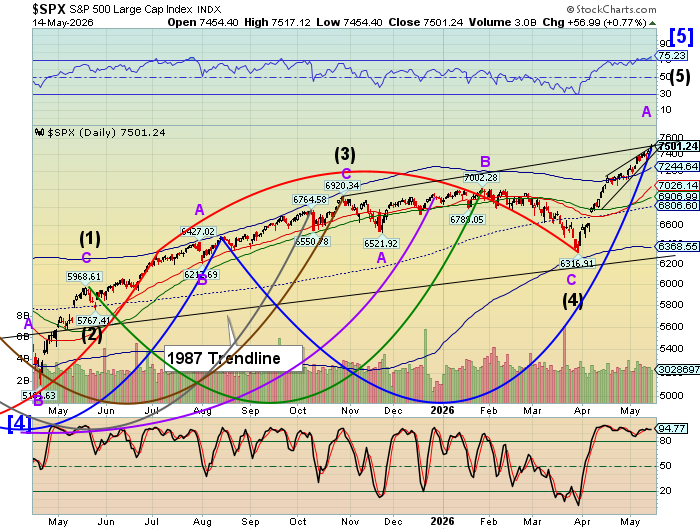
SPX futures dropped to 7413.50 before bouncing off the lower Ending Diagonal trendline. It is hovering above the trendline as I write. Today is monthly options expiration and the morning options are about to expire. The further the SPX declines, the more options expire worthless, which may cause a selling feedback loop as remaining call holders scramble to unload. This may be further exacerbated in the leveraged ETFs. A further decline beneath 7400.00 issues a sell signal that should not be ignored. The Cycles Model allows a possible 2-3 week decline. Possible targets may be the 52-day Moving Average at 6906.99 or the mid-Cycle support at 6806.60.
This afternoon’s options chain shows Max Pain at 7465.00. Long gamma begins at 7470.00 while short gamma prevails beneath 7460.00. There is a put wall at 7400.00. Should the SPX go beneath it, prices may go over a cliff.
ZeroHedge reports, “Bond yields, oil and the dollar are surging this morning as US futures tumble from all-time highs, with Tech underperforming driven by a series of factors including i) surging energy prices on lack of Iran war progress, ii) elevated positioning into options expiry; iii) Central bank repricing, iv) Tech sell-off driven by higher yields, and v) strikes at Samsung Electronics.”
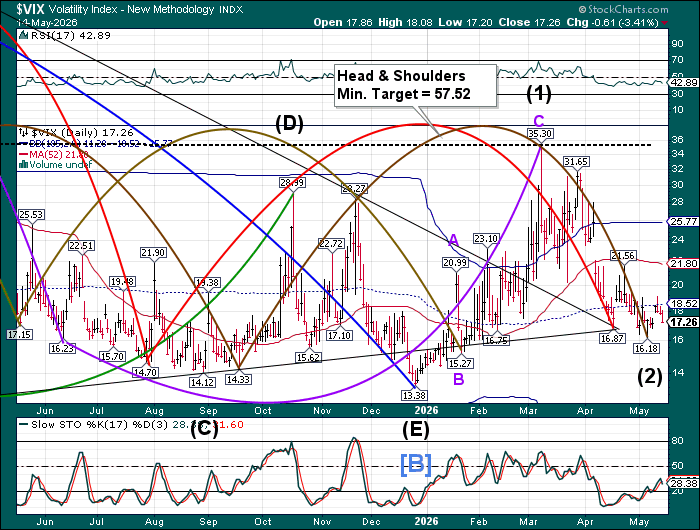
The premarket VIX rose to 19.24 this morning and may close in on the 52-day Moving Average at 21.80 in short order. Should the VIX reach the neckline by May 20, the Master Cycle may be adjusted from May 6 to May 20 to reflect that move, called a “double reversal”.
The May 19 options chain shows Max Pain at 22.00. Short gamma resides between 16.00 and 20.00. Long gamma begins with a call wall (over 250,000 contracts) at 25.00 and runs with call walls nearly every 5 points to 95.00, signifying institutional interest.
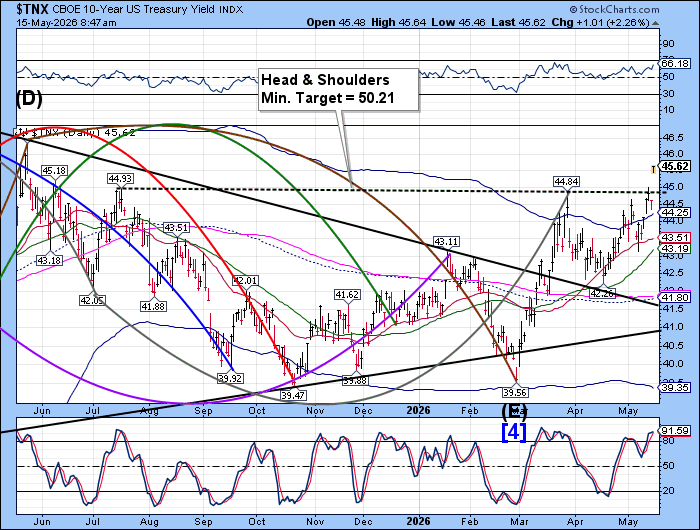
The US 10-year Bond Yield burst through its neckline at 44.84 to exceed the dreaded 45.00 level. The Japanese 10-year rate is also rising, causing potential destabilization in the equities markets.
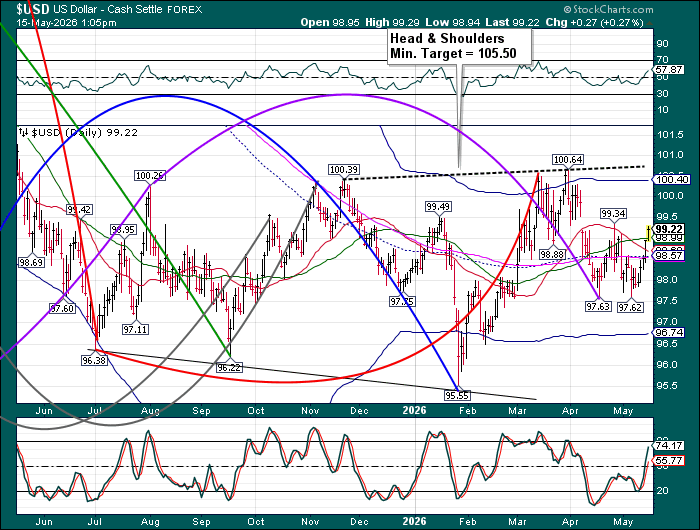
USD vaulted above the 52-day Moving Average, cementing the buy signal. The Cycles Model suggests the rally may last to early June, causing grief to the dollar shorts. A further rally from here may instigate a short squeeze that may propel the USD above the Head & Shoulders neckline, with knock-on effects.
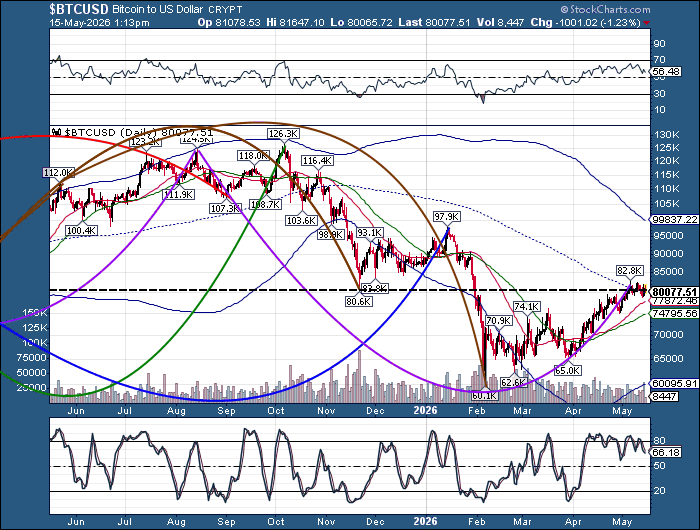
Bitcoin tested the horizontal trendline yet again this morning, then fell away. The Cycles Model calls for a short, but possibly deep decline to a lower support before resuming its rally. It may be targeting the Cycle Top currently at 99837.00 by the end of June.

Comments
Log in or sign up to join the conversation.