
We are still in the process of determining what’s in the Build Back Better (BBB) bill, but it approximates what is currently discussed. It in conjunction with the Infrastructure Investment and Jobs Act (IIJA) will not likely lead to much pressure in credit markets and upward pressure in prices, given it is largely paid for. Here (while we wait for the CBO) are Moody’s Analytics projections (as of Nov. 4).
First, net impact on the budget deficit from BBB alone.
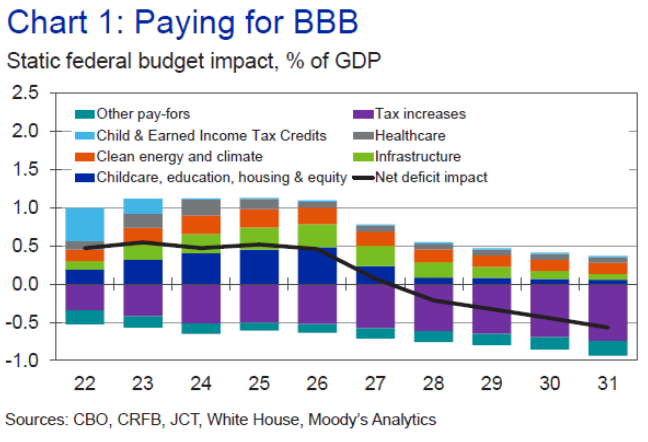
Source: Zandi (Nov. 2021).
Next is the impact on nonfarm payroll employment in baseline, and with certain combinations (where American Rescue Plan (ARP) has already been passed, so that can be viewed as the baseline against which to compare the ARP+IIJA, ARP+BBB, and ARP+IIJA+BBB.
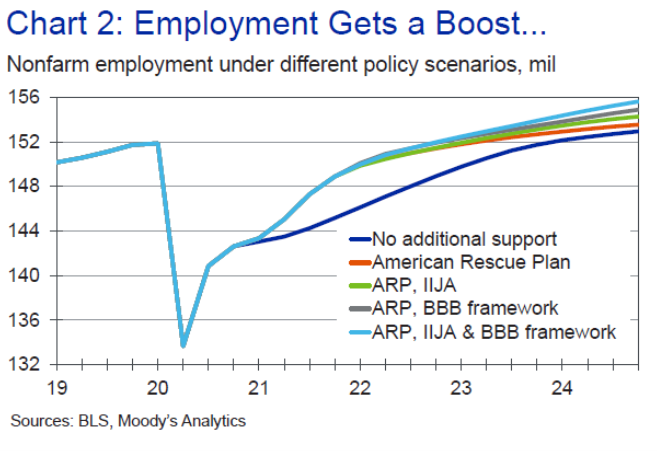
Source: Zandi (Nov. 2021).
Employment at end-2023 will only be slightly higher (relative to ARP) if IIJA alone is implemented. Obviously, with passage of both BBB and IIJA, employment would be noticeably higher.
What about GDP and components? Table 3 in Zandi (Nov. 2021) outlines the impacts. I excerpt the GDP impacts for up to 2023 Q4.
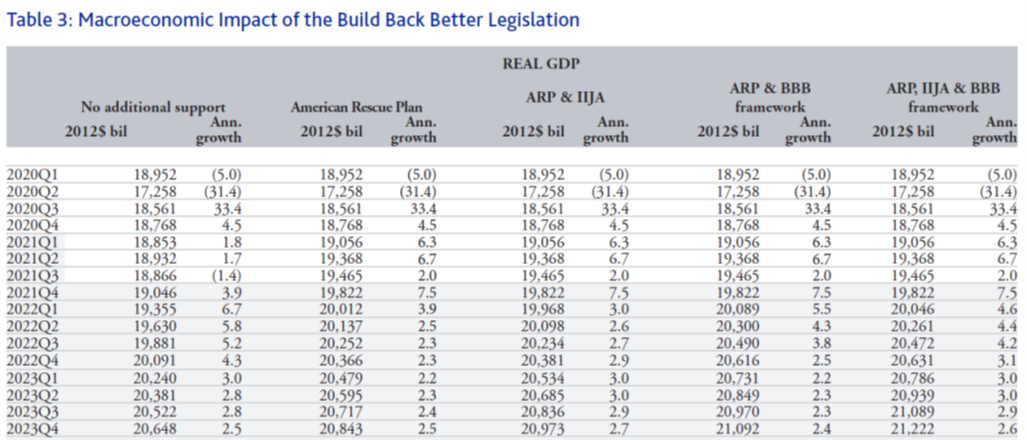
Source: Zandi (Nov. 2021).
As of 2023 Q4, with IIJA and BBB implemented, real GDP will be about 1.8% higher than projected with only ARP implemented. Zandi does not provide estimates of the impact on interest rates or inflation. I can use my estimates of the slope of the Phillips curve to guess the impact on the price level (so I ignore implications for expected inflation).
If the sensitivity of the price level to the (Delong-Summers version of the) output gap is 0.20, then the price level would be about a third of a percentage point higher than otherwise. My 0.20 estimate is much larger than what I obtained using a conventional output gap. Using that (not statistically significant) estimate, the price level would about 5 bps higher.
Obviously, one has to believe in the assumptions built in to condition the model (the rest of the world, monetary policy, evolution of COVID-19, etc.), as well as the model itself.
The Moody’s Analytics Global Macroeconomic Model appears to be a large scale multi-equation (thousands) macroeconometric model, where the functional equations have been estimated (rather than calibrated). An abstract of the model description is here. A schematic from the description is here:
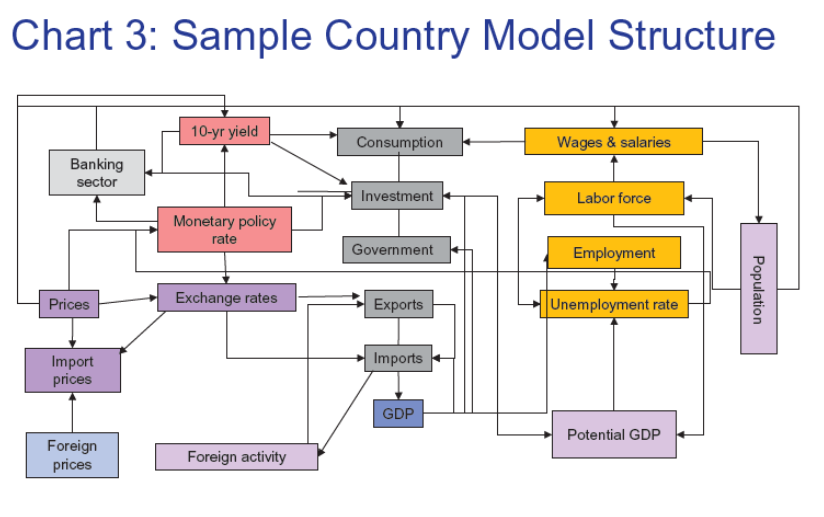
Source: Hopkins (2018).
For a discussion of distinctions between macroeconometric models, dynamic stochastic general equilibrium models, and VARS, see this (2009) post. Note that some models are somewhere between two categories; for instance, the Fed’s FRB/US model incorporates some calibrated parameters, but many estimated equations, while the Fed’s SIGMA and EDO models are DSGEs.
For the congressional debates, the official arbiters of the impact on the budget deficit and economic output is the Congressional Budget Office (and for the impact on the budget deficit/revenues/expenditures, CBO in conjunction with the Joint Committee on Taxation, JCT). CBO’s forecasting model is described in Arnold (2018). That’s why CBO is now working overtime.
Addendum, 1:20pm Pacific: CRFB tabulation of Nov 4:
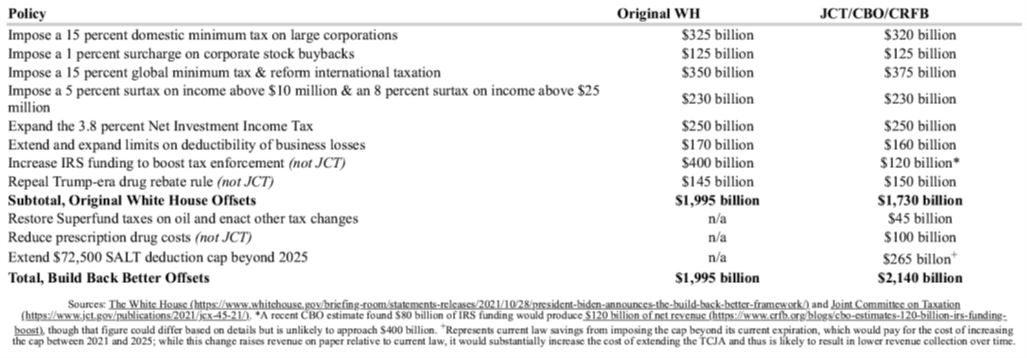
Source: CRFB (Nov 4, 2021). From the article.
Last week, the White House estimated that its Build Back Better framework included $1.995 trillion of offsets before accounting for the recent prescription drug pricing reforms and changes to the cap on the state and local tax (SALT) deduction. Based on new estimates from the Joint Committee on Taxation (JCT) and a September estimate from the Congressional Budget Office (CBO), it appears official scorekeepers will find closer to $1.7 trillion of offsets from provisions in the original framework and over $2.1 trillion in total offsets. This is likely to roughly cover the new spending and tax cuts in the reconciliation package, though it could fall somewhat short, depending on the costs of the paid leave and immigration provisions.
Among the offsets scored by JCT, the official estimates are mostly in line with those from the Administration. The White House originally estimated about $1.45 trillion of revenue, including $800 billion from corporations, $420 billion from passthrough entities, and $230 billion from surtaxes on income above $10 million. JCT estimates $1.46 trillion of total revenue, including $820 billion from corporations, $410 billion from passthrough entities, and $230 billion from the new surtaxes. The Administration also claimed $145 billion of savings from canceling the Trump Administration’s drug rebate rule – an estimate that we find reasonable and include in our analysis.
Missing from the JCT score is an estimate of the proposed $80 billion increase in Internal Revenue Service (IRS) funding, which will need to be scored by CBO. Based on recent estimates from CBO, we believe the agency will conclude that new IRS funding to narrow the tax gap will raise roughly $120 billion on net, substantially lower than the Administration’s estimate of $400 billion. While the Administration believes $80 billion of tax enforcement funding will raise $320 billion of gross revenue directly and generate another $160 billion by discouraging tax cheating, CBO believes the direct and indirect effects will raise $200 billion of gross revenue on a combined basis.
Assuming a $120 billion net boost results in over $1.7 trillion of net offsets in the original framework, compared to the White House’s estimate of $1.995 trillion.


Comments
Log in or sign up to join the conversation.