
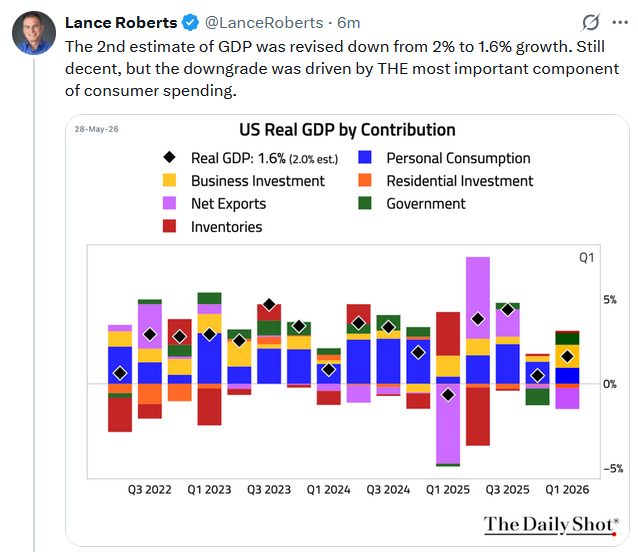
One of the most underappreciated risks to the economic outlook is the historically low personal savings rate and its impact on personal consumption. At roughly 2.6%, the current savings rate is the lowest since 1960, excluding a few years before the 2008 financial crisis and a month or two during the pandemic. For context, the average since 2010 is 6.60%. Excluding the pandemic volatility in savings (2020-2023), the average since 2010 is 5.90%.
The personal savings rate is a direct result of consumers’ spending decisions. When consumers save less, by definition, they spend more, and vice versa. The declining savings rate, as we show below, combined with the fact that personal consumption accounts for roughly two-thirds of GDP, has led to a meaningful tailwind for GDP growth over the past two years. The reduction in savings to its current low rates has helped sustain spending despite a recent decline in real wages. Simply, we, in aggregate, have been funding our spending by saving less.
The problem is that historically, low savings rates tend to revert higher. Whether driven by rising unemployment, tightening credit conditions, or a simple behavioral cautionary shift, as consumer confidence data hints at, households will eventually rebuild their financial cushions. Thus, consumers will, at some point, save more and spend less, creating a headwind for economic growth.

What To Watch Today
Earnings

Economy

Market Trading Update
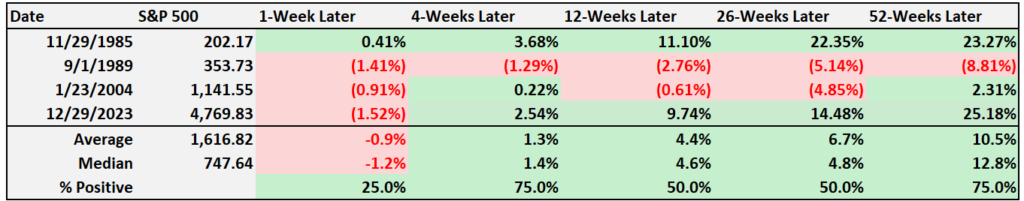
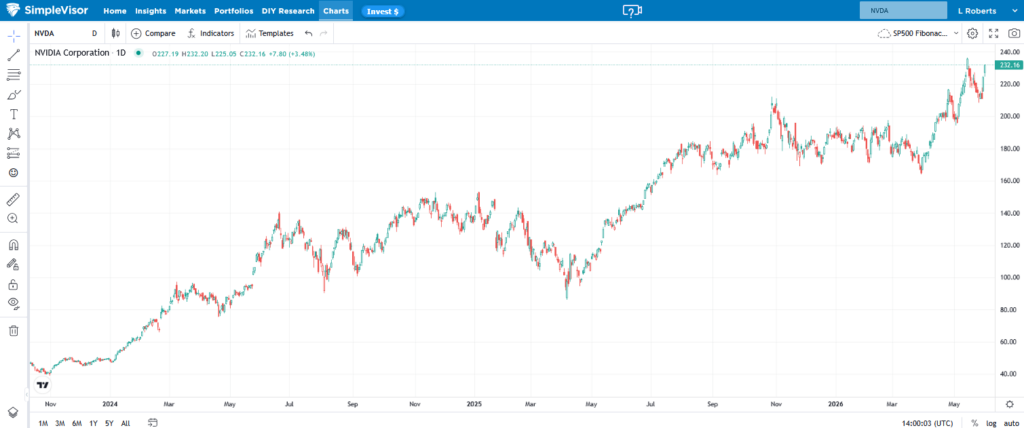
On Friday, we touched on the surge in Semiconductor stocks. The market finished higher on Friday, extending the weekly winning streak to 9, a feat that has occurred only 4 times since 1965. With the exception of 1989, the markets were consistently higher 12, 26, and 52 weeks later. However, the odds of a corrective week or two are rising sharply.
The trend is unambiguous. The S&P 500 closed Friday at 7,580.06, posting fresh all-time highs on three of the last five sessions and clearing the prior closing record by roughly 1.4% on the week. The index sits firmly above its 50-day moving average at 7,058 and 200-day moving average at 6,830, putting the price roughly 7% above the 50-DMA and nearly 11% above the 200-DMA. On the momentum side, the 14-day RSI has climbed above 70 and is back in overbought territory. Additionally, the MACD has expanded with the new highs and is crossing back above its signal line.
By the standard measures, the bull trend that resumed after the April 7 Iran ceasefire is fully intact and accelerating. A retracement to the previous all-time highs, where the market broke out after the April correction, is about 7.5% lower. While such a correction should be expected, given the high levels of complacency during the advance, such a decline will feel far worse than it actually is.
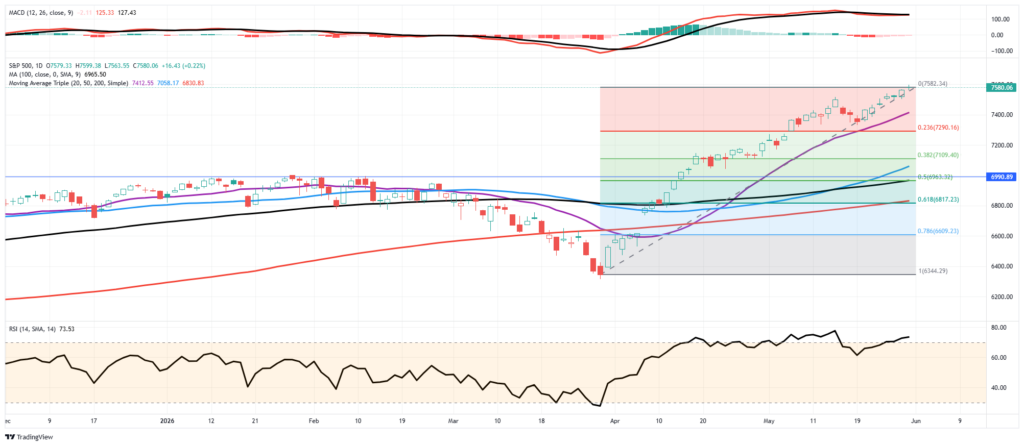
However, the warning signs underneath the surface are getting louder, not quieter. Breadth continues to deteriorate. The percentage of S&P 500 members trading above their 200-day moving average is still hovering near 57%, essentially unchanged from a week ago despite the index hitting new records. Equal-weight is now lagging cap-weight by a meaningful margin over the trailing month, and the cumulative advance-decline line has been making lower highs even as the index makes higher ones. Notably, that’s a textbook bearish divergence. The Nasdaq remains the standout, but the lift is being delivered by a handful of AI-linked mega-caps doing the heavy lifting.
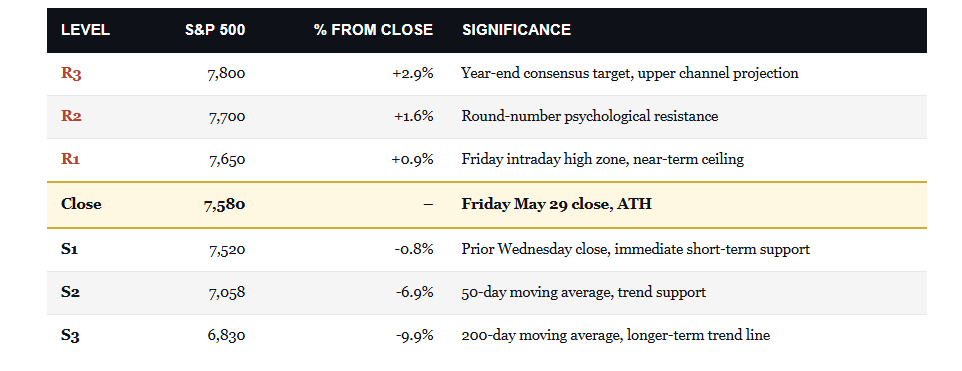
The technical setup for next week makes adding more to equity exposure at current levels uncomfortable. Above the close, resistance sits at the round-number psychological level of 7,700, followed by the consensus year-end target zone near 7,800. Below, the rapidly trailing 5-day moving average around 7,550 is now the first short-term floor, and the prior Wednesday close at 7,520 acts as immediate support. Importantly, a break of 7,520 opens significant room before the next major support. The upside to consensus year-end targets is 2% to 3%. The downside to a routine test of the 200-DMA is 10%.
For positioning, the indicated trade is to use these new highs to harvest gains, not to chase them. Specifically, we continue to suggest trimming positions that have run materially above target weight. Tighten trailing stops on the most extended names, semis especially. Hold new cash deployments back until breadth confirms or a technical break invalidates the trend. With the VIX at 15.32, near its lowest level since January, downside protection is unusually cheap right now.
The Week Ahead
The labor market will take center stage this week, with JOLTs on Tuesday, monthly ADP on Wednesday, and the BLS Employment report on Friday. The current forecast for BLS job growth is 102k, similar to last month’s 115k. Growing attention is being paid to the average hourly earnings. Last month they grew by 0.2% or 2.4% annualized. Such is below the current inflation rate resulting in a decline in real wages. This helps explain the low savings rate and recent commentary by Walmart about the thrifty behaviours of its customers.
It appears the first time we will hear from Kevin Warsh in his official role as the Fed Chair will be at the next FOMC meeting on June 17th.
Dollar Dominance Remains Alive And Well – Part One
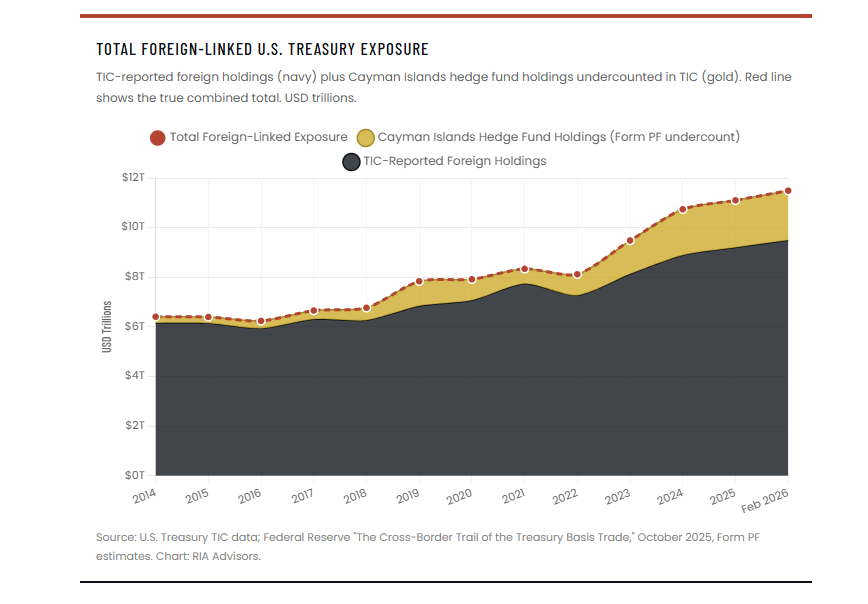
The dollar is supposed to be dying. We’ve heard that argument for the better part of a decade, and it’s getting louder, not quieter. The narrative goes that BRICS countries are building an alternative, that China is dumping Treasuries, that gold is replacing the dollar as the world’s reserve asset, and that Washington is so desperate to find buyers for the next debt issuance that it’s now offering dollar swap lines to Gulf states as a backdoor liquidity rescue. Make no mistake, the “Persistent Purveyors of Doom” have a story. However, the data doesn’t support any of it.
Dollar dominance isn’t fading. In fact, the events of late April 2026 just delivered the loudest counter-signal in years.
Tweet of the Day

Comments
Log in or sign up to join the conversation.