

To build a bit more on the idea of Treasury bill liquidity flows from the video and update on Saturday, we do have a sense of issuance size between now and the end of September based on the Treasury Quarterly Refunding announcement, which projects borrowing of $671 billion. That is higher than the $577 billion borrowed during the January-to-March period.
Basically, if the Treasury has indicated that coupon sizes will remain unchanged, then a good amount of the additional $100 billion in issuance would likely need to come through bills. Even if bill issuance remains unchanged from the first quarter, there will still be a sizable amount of liquidity removed from the market by the bill issuance.

So how will we know if this T-bill issuance is putting strain on markets? Fairly easily — by watching changes in SOFR on a daily basis.
I do not think it is a coincidence that we saw SOFR tighten materially in the fall and then ease materially this spring after the reverse repo facility hit its lower bound in October and market conditions began to tighten.
But now that we are past the paydown phase, we should begin to see SOFR creep higher again and spreads start to widen. This coming week should provide a good test of that, with roughly $100 billion set to be drained from the market. If that liquidity drain matters, we should see SOFR rates move higher.
The early signs are already there, with the weighted-average repo rate on Friday trading at 3.61% amid sharply increased Treasury issuance last week.
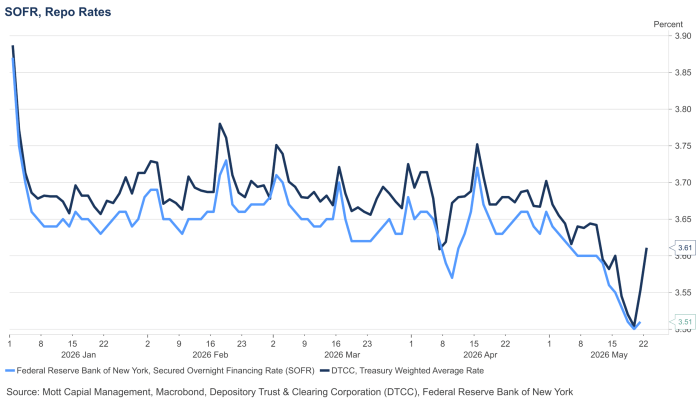
The liquidity flows that had been supportive are now beginning to reverse, and in many ways already have. My guess is that when we get the SOFR reading on Tuesday morning, it will print closer to 3.60% rather than 3.50%, suggesting that the ramped-up issuance over the past two weeks is beginning to absorb excess cash from the system.
The best real-time proxies we have for tracking liquidity conditions remain Bitcoin (BTC.X) and, to a lesser degree, the Invesco Global Listed Private Equity ETF (PSP) and the Financial Select Sector SPDR ETF (XLF).

We will see where this all goes over the next few months.


Comments
Log in or sign up to join the conversation.