

Semiconductor processing equipment designer Lam Research (LRCX) releases its fiscal Q1 results on Wednesday, Oct. 21, for the quarter ending Sept. 2026. Analysts forecast higher revenue and FCF. Shorting out-of-the-money (OTM) LRCX puts is an attractive play.
LRCX closed at $263.94 on Friday, Oct. 16, down almost 5%. It's been on a downtrend for the last two weeks, as Barchart's chart below shows. It peaked at $347.49 on Oct. 2 and is now near 3-month lows. That's a 24% decline in just two weeks.
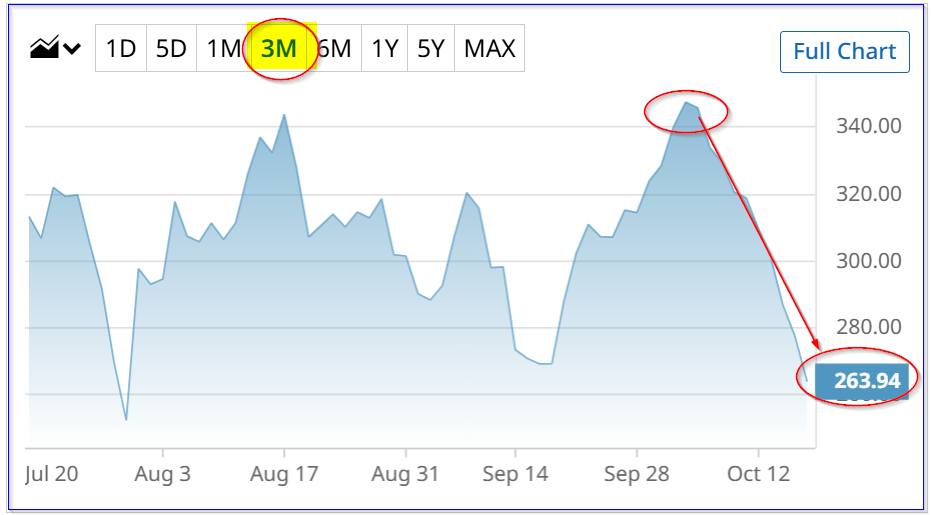
LRCX stock - last 3 months - Barchart - Oct. 16, 2026
Other semiconductor stocks have slipped as investors await further updates on whether the AI boom is translating into real cash flow for the companies. For example, the SOXX iShares semiconductor stock ETF is down 16.3% since Oct. 6.
The bottom line is that investors are nervous about whether these companies can keep generating strong free cash flow (FCF). Will their AI-related orders peter out?
LRCX Expectations
Analysts forecast fiscal Q1 revenue of $8.13 billion for Lam Research, which designs and makes essential equipment for semiconductor manufacturers. That will be +20.9% higher than last quarter ($6.722 billion in Q4), and +52.7% over last year's fiscal Q1.
Moreover, this fiscal year ending June 30, 2027, revenue is forecast to climb +61% from $21.68 billion last FY to $34.92 billion.
Moreover, despite a dip in its free cash flow (FCF) last quarter ($1.268 billion vs. $2.382 billion last FY Q4), Lam Research's FCF margin should still be at least 21%.
That was its trailing 12-month (TTM) FCF margin last quarter. It could end up significantly higher. With higher revenue, the FCF margin tends to rise. Last year, its TTM FCF margin in Q1 was 28.33%.
As a result, assuming it makes a 28.33% FY 2027 margin, FCF could rise to almost $10 billion:
$34.92 billion est. FY27 revenue x 0.2833 = $9.89 billion FCF
That compares with $4.89 billion in FCF last FY. This could result in a significantly higher price target (PT) for LRCX stock.
Higher Target Prices for LRCX
For example, assuming it generates $9.89 billion in FCF and using a 2.5% FCF yield metric (as it typically has had), its fair market value (FMV) could be almost $400 billion:
$9.89b / 0.025 = $395.6 billion FMV
That's about 20% higher (+19.8%) than today's market value of $330.3 billion (Yahoo! Finance market cap calculation).
In other words, the price target (PT) is 19.8% over Friday's close:
$263.94 x 1.198 = $316.20 PT
That's $52.26 over Friday's close. But other analysts have higher PTs. For example, Yahoo! Finance's survey is at $375.81 from 35 analysts, and Barchart's mean survey PT is $378.20. Those PTs are $113 higher on average, implying 42.8% upside.
The bottom line is that if the Q1 FCF and FCF margins come in higher than expected, LRCX could be worth significantly more.
One way to play this, in case the stock stays flat or declines a little, is to sell short out-of-the-money (OTM) put options. That way, an investor can collect income upfront for the obligation to buy LRCX at a lower price.
Shorting OTM LRCX Puts
For example, the Nov. 20, 2026, expiry period shows that the $240 strike price put has an attractive premium of $8.80. This strike price is 9% below Friday's close (i.e., it's out-of-the-money).
So, if an investor posts $24,000 in collateral with their brokerage firm and then enters an order to “Sell to Open” 1 put at $240, the account will immediately collect $880. That works out to an expected yield of 3.666% (i.e., $880/$24,000).
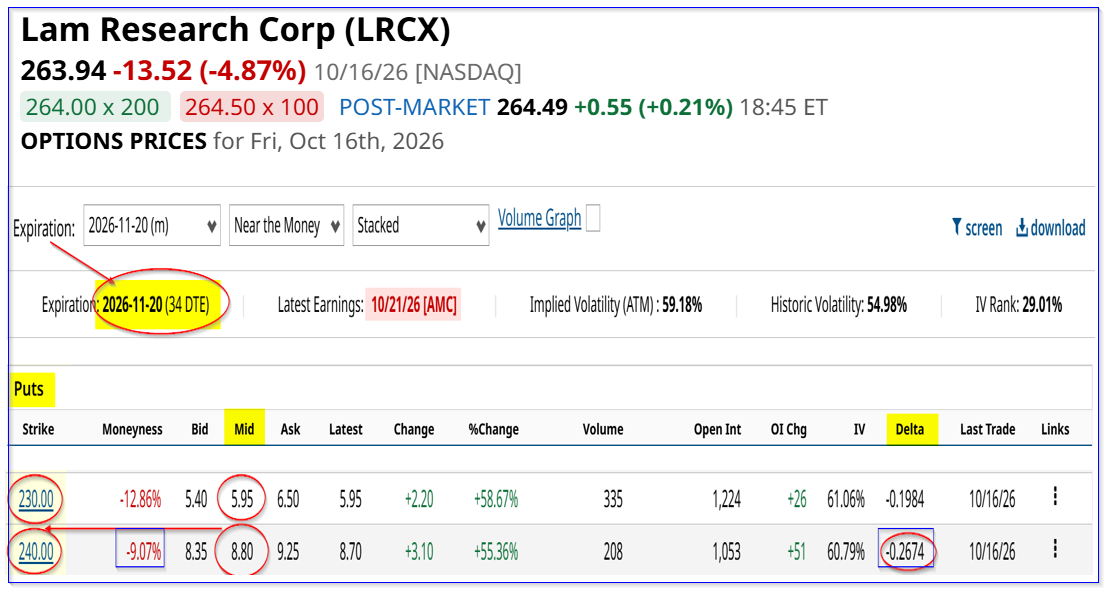
Note that the delta ratio is low: -0.2674. That implies a 73% chance of success - i.e., that LRCX will not drop to $240 by Nov. 30.
But even if that happens, the investor has a low breakeven buy-in point upon assignment: $231.20 (i.e., $240 - $8.80). That's 12.4% below Friday's close.
LRCX Put Credit Spread Play
For investors who don't have $24K, a put credit spread requires much less collateral, although there is much more risk.
For example, buying the $230 put along with shorting the $240 put results in a net credit of $285 (i.e., $880 - $595). But the brokerage firm will only require $1,000 in collateral (i.e., $240-$230 x 100).
The at-risk amount is only $715 ($1,000 - $285 spread received). So, the expected return is very high:
$285/$715 = 39.86%.
However, the risk is that if LRCX drops to $230, the investor could lose the whole $715 at risk amount. This is essentially a net that LRCX won't drop 12.85%. The -19.84% delta ratio implies an 80% chance of success.
Positive Expected Return
Let's say there is only a 75% chance of ending up with the full $285 put credit and a 25% chance of losing $715. (This chance is implied from the two delta ratios.)
The expected return is positive $35:
$285 x 0.75 = $213.75 - (0.25 x $715) = $213.75 - $178.75 = $35.00 ER
That works out to a 5% expected ROI (i.e., $35/$715 at risk = 4.895%). That is higher than the 3.666% short-put expected return at a similar chance of success.
The bottom line is that investors can take advantage of LRCX's depressed price with short put and put credit spread plays.

Comments
Log in or sign up to join the conversation.