

KLA Corp., Elliott Wave Technical Analysis
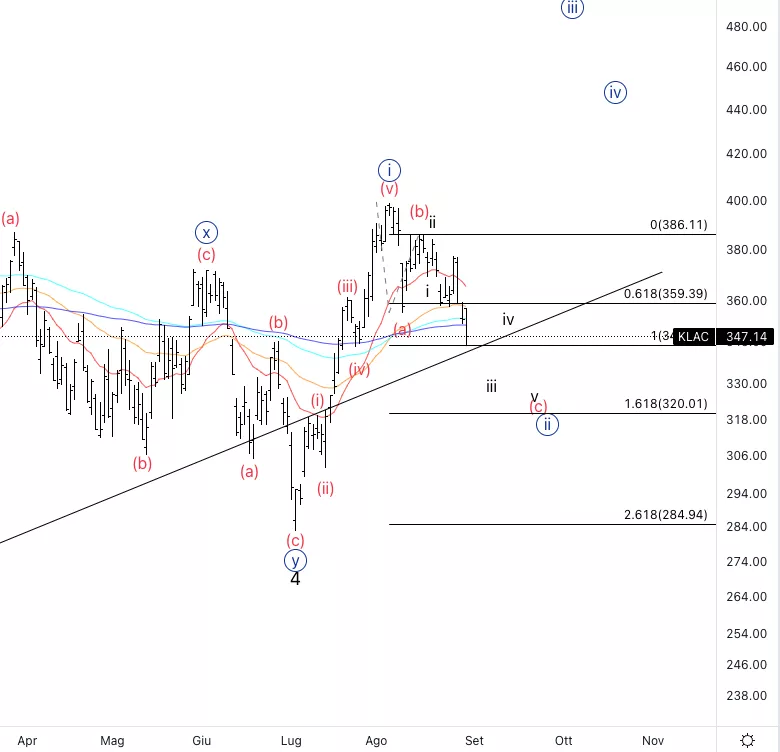
KLA Corp., (KLAC): Daily Chart, August 31, 2022,

KLACStock Market Analysis:We have reached equality of wave (a) and c), which is often times a zone where we start to see reversals. However the move lower in wave c) does not look completed.
KLAC Elliott Wave count: c) of {ii}
KLACTrading Strategy: Looking for the completion of wave {ii} to then look for longs.
KLACTechnical Indicators:We are sitting at the 200EMA(purple line) as well as we are moving lower on the RSI indicating a loss in momentum.
TradingLounge Analyst: Alessio Barretta
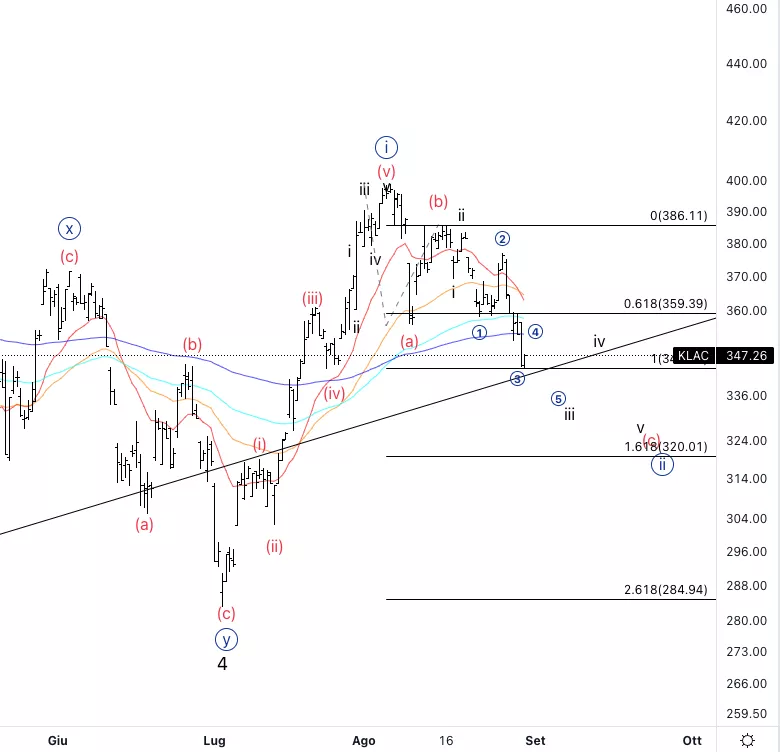
KLA Corp., KLAC: 4-hour Chart, August 31 2022,
KLA Corp., Elliott Wave Technical Analysis
KLAC Stock Market Analysis: Looking for continuation lower into wave iii of (v) as the move lower into wave c) looks like an incomplete bearish move.
KLACElliott Wave count: Wave iii of (v).
KLAC Technical Indicators:Indicators suggest for further downside as we are below all averages.
KLACTrading Strategy: We could look for short term short positions to unfold to complete wave {ii}.
More By This Author:
Bitcoin Technical Analysis Elliott Wave Trading Strategies
Elliott Wave Technical Analysis: Broadcom Inc. (AVGO)
Uniswap Elliott Wave Analysis - Tuesday, Aug. 30



Comments
Log in or sign up to join the conversation.