
A Chief Financial Officer needs to know her way around a financial statement. Presenting operating performance in the best possible light is a highly valuable skill. We watched Kinder Morgan’s (KMI) Analyst Day last week via webcast, and my admiration is split between (1) KMI CFO Kim Dang’s deft maneuvering among numbers, and (2) my detail-oriented partner Henry Hoffman for spotting the sleight of hand.
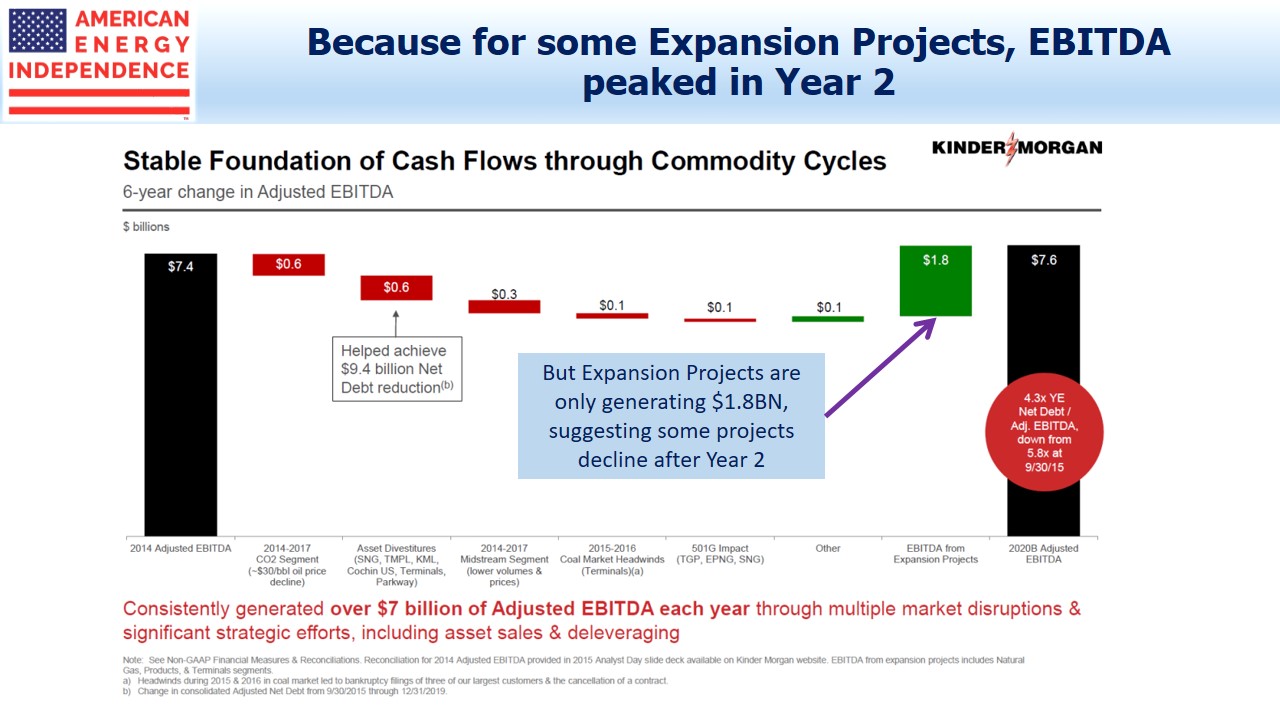
The story begins where KMI uses a “bridge” chart to show how EBITDA changed from 2014 to 2020. Dang introduced the slide as answering a common investor question: if you’re doing so well, why isn’t EBITDA growing more?
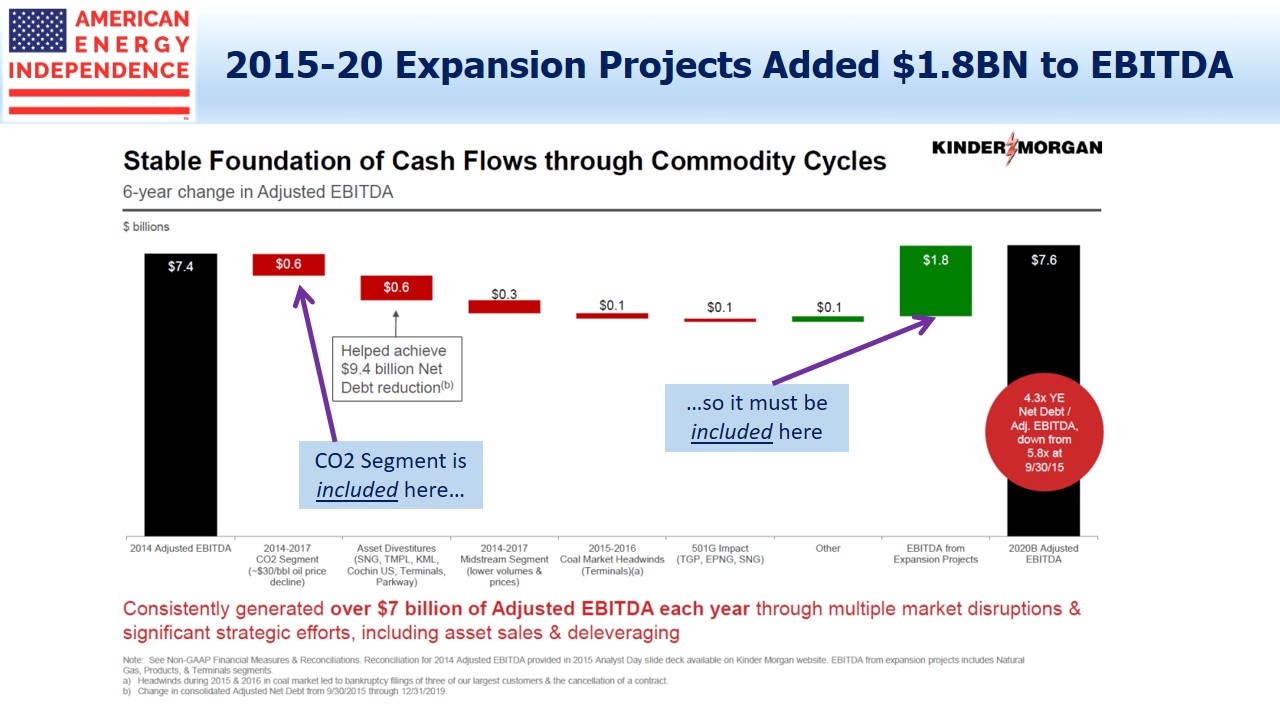
The chart includes the much criticized CO2 segment, which sells CO2 for Enhanced Oil Recovery (EOR) as well as being used by KMI itself for that purpose. CO2 contributed a $0.6 billion decline to EBITDA from 2014-20. Since its decline is shown on the chart, it must also be part of the $1.8 billion EBITDA increase from Expansion Projects, because the $7.6 billion 2020 Adjusted EBITDA is for all of KMI.
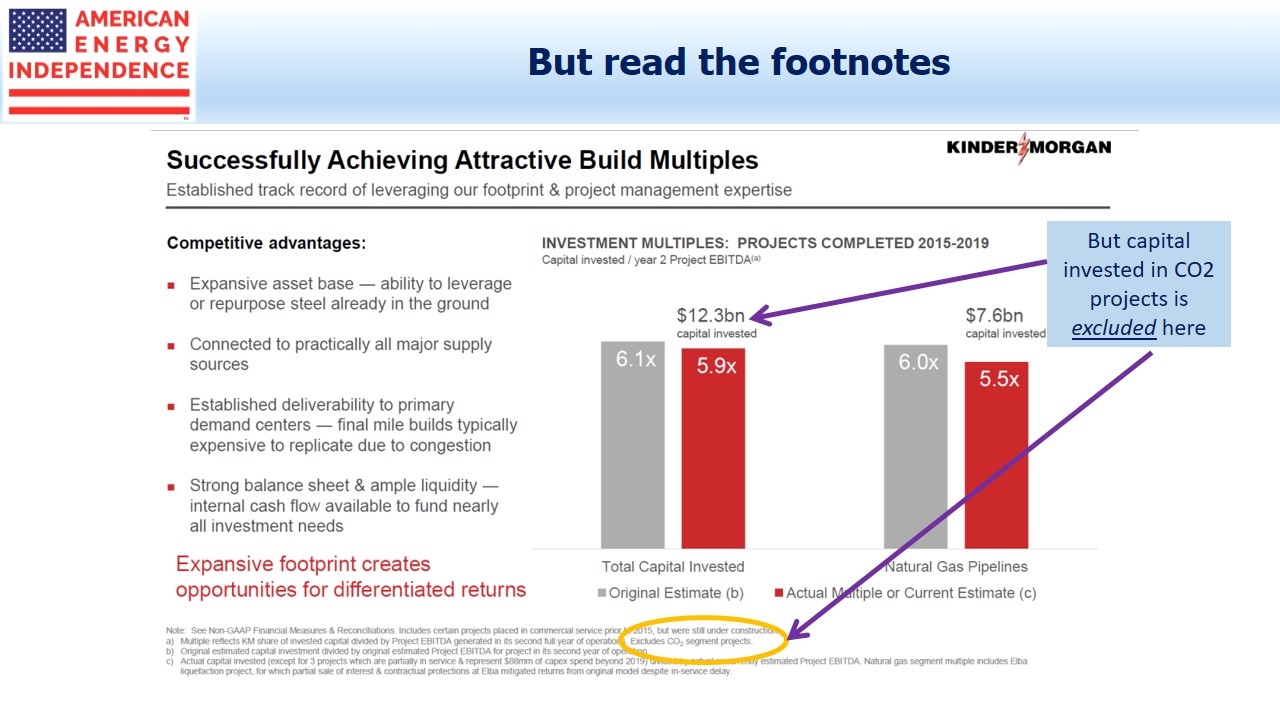
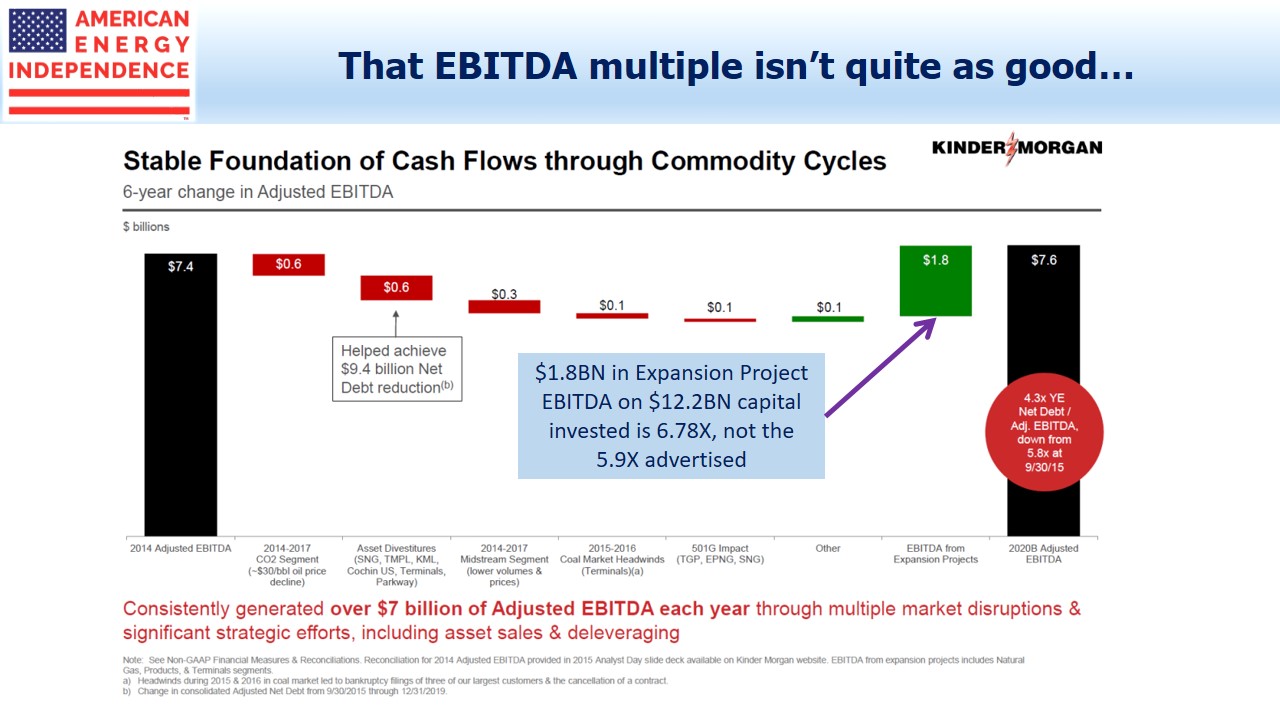
Another slide shows an attractive EBITDA multiple on capital invested, of 5.9X. In other words, $100 invested will return its capital invested over 5.9 years. The reciprocal of 5.9X is the return, a juicy 16.95% in this case and well over KMI’s assumed cost of capital. The 5.9X multiple implies these projects are generating $2.08 billion in EBITDA.
But the small print notes that on this slide, CO2 segment Expansion Projects are excluded.
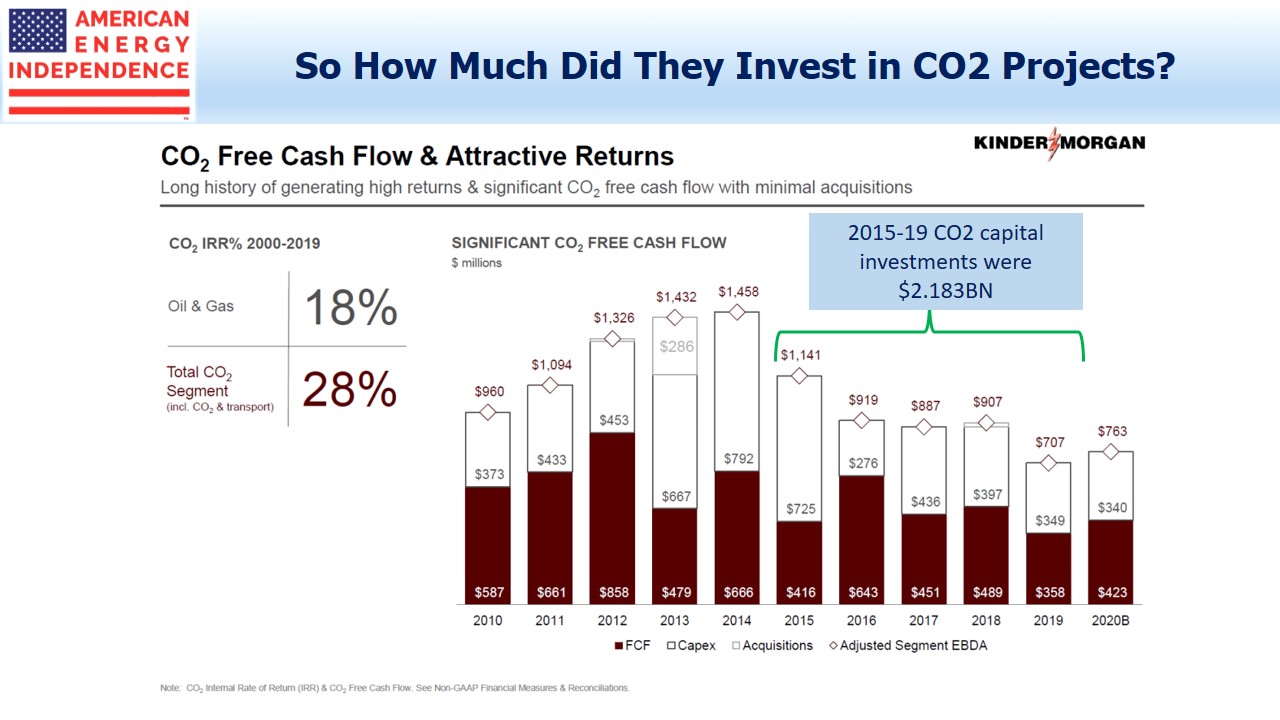
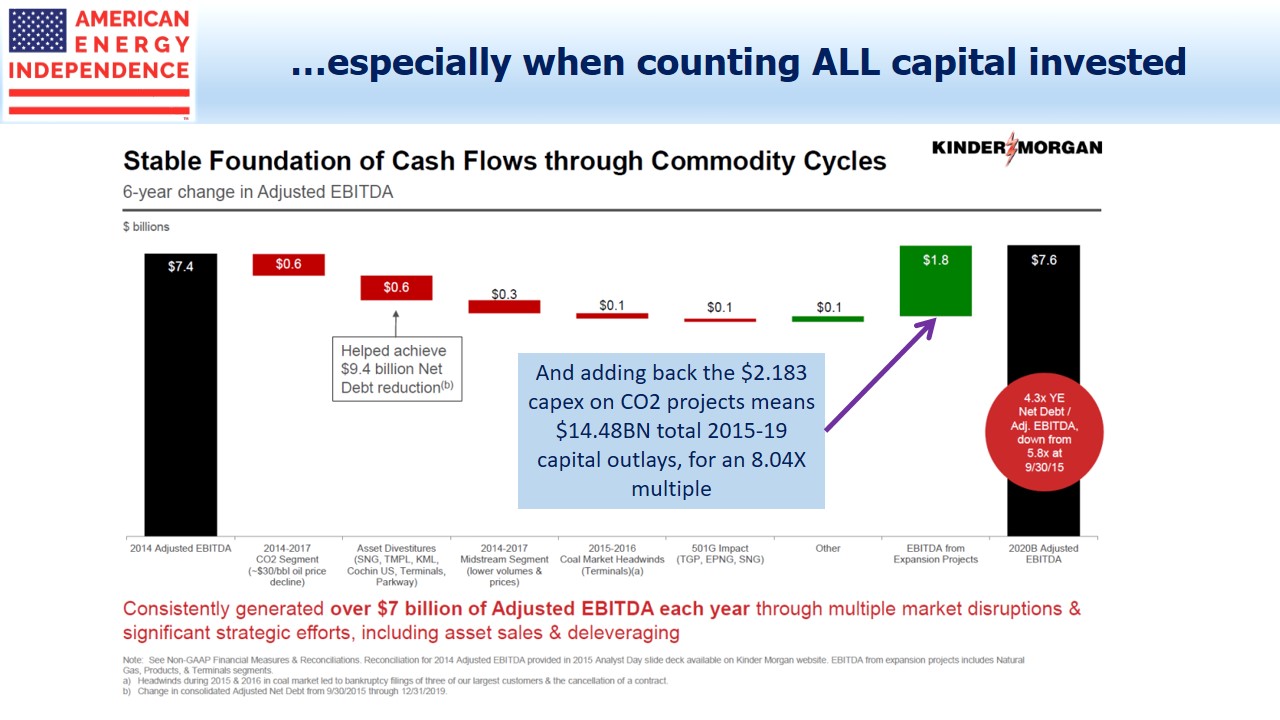
To find out what KMI invested in CO2 projects 2015-19, we turn to another slide, which shows annual figures. Adding up the Capex for 2015-19 gives $2.18 billion.
So KMI’s total capex over the period covered was not $12.3 billion but $14.48 billion, once you add back CO2.
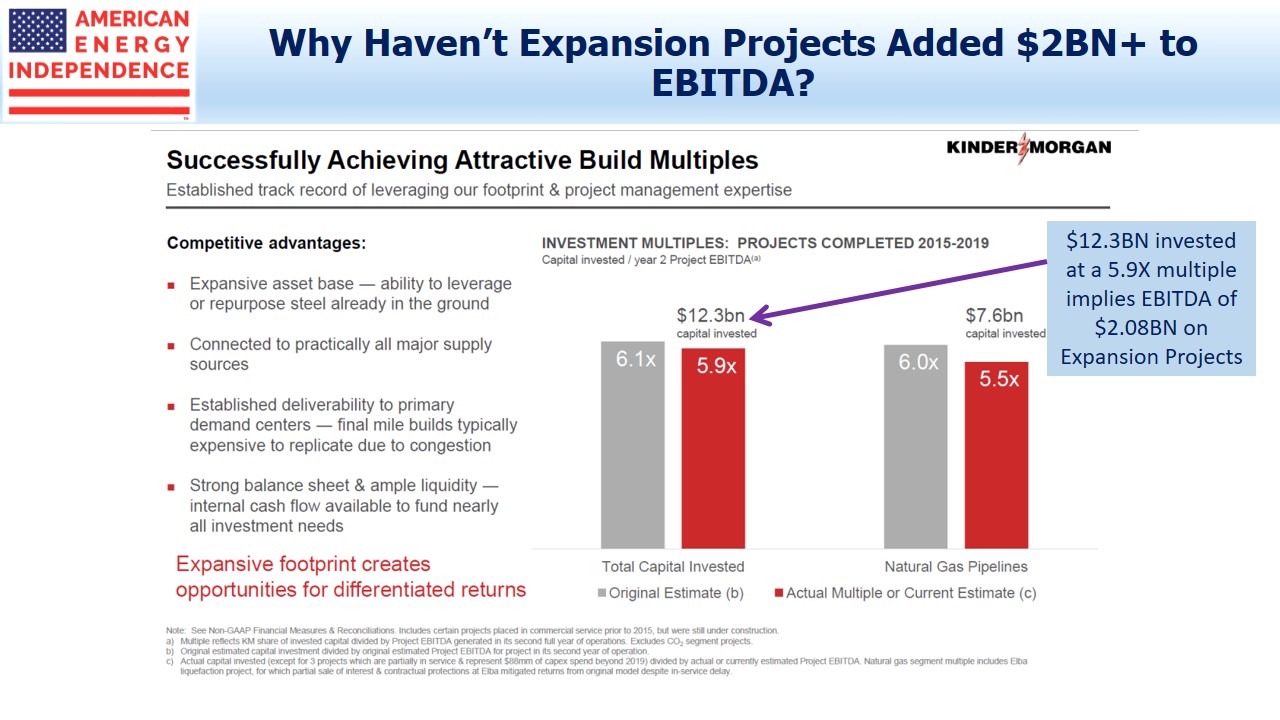
This makes the EBITDA multiple on new investments a little less stellar. The $1.8 billion in EBITDA from Expansion Projects that required $12.3 billion in investment equates to a 6.78X multiple. But since we know the $1.8 billion EBITDA is from all Expansion Projects, including the CO2 business, it’s appropriate to add back the $2.18 billion invested in CO2 Expansion Projects to get the true total.
That means the $1.8 billion in “growth” EBITDA was earned on $14.48 billion in capex, or a multiple of 8.04X. That’s 12.44% rather than the 16.95% calculated earlier. It’s pre-tax, and excludes interest expense as well as depreciation.
KMI uses more than one EBITDA definition through these slides, so you have to follow carefully. When calculating the EBITDA multiple, they like the “Year 2 Project EBITDA”, with its implied $2.08 billion in EBITDA. The EBITDA bridge chart simply shows 2020 EBITDA of $1.8 billion from all new projects initiated since 2015. Why are they different, and what does it mean?
Investment outlays have been falling since 2015, which means that the projects funded since then are, on average, past the two year mark. 2020 capex is almost a third lower than it was in 2015.
Since the $2.08B billion “Year 2 Project EBITDA” is above the $1.8 billion 2020 EBITDA from Expansion Projects in the bridge chart, and we know the average project is more than two years old, it means that EBITDA from new projects is declining. Using the “Year 2 Project EBITDA” flatters the results. Management teams persist in using EBITDA multiples, which are easily manipulated, rather than NPV and IRR. It’s as if they don’t think their investors will understand them – or maybe they’ve concluded that EBITDA multiples are easier to obfuscate.
Following this is admittedly a complicated exercise, but it illustrates the agile numeracy required of today’s energy sector CFO, and of the investors interested in properly understanding their business. KMI is certainly not alone in using financial complexity to their benefit. In this case, we think it’s driven by their continued retention of the CO2 business, which they should sell. Apart from that, KMI has some great assets.


Comments
Log in or sign up to join the conversation.