
I’m the last person you’d expect to read this from, but – – could crossing the 4,000 on the S&P 500 just be the start of another massive up-leg in the market? Wait, Tim, what? Are you crazy? Well, I refer once again to this chart:
(Click on image to enlarge)

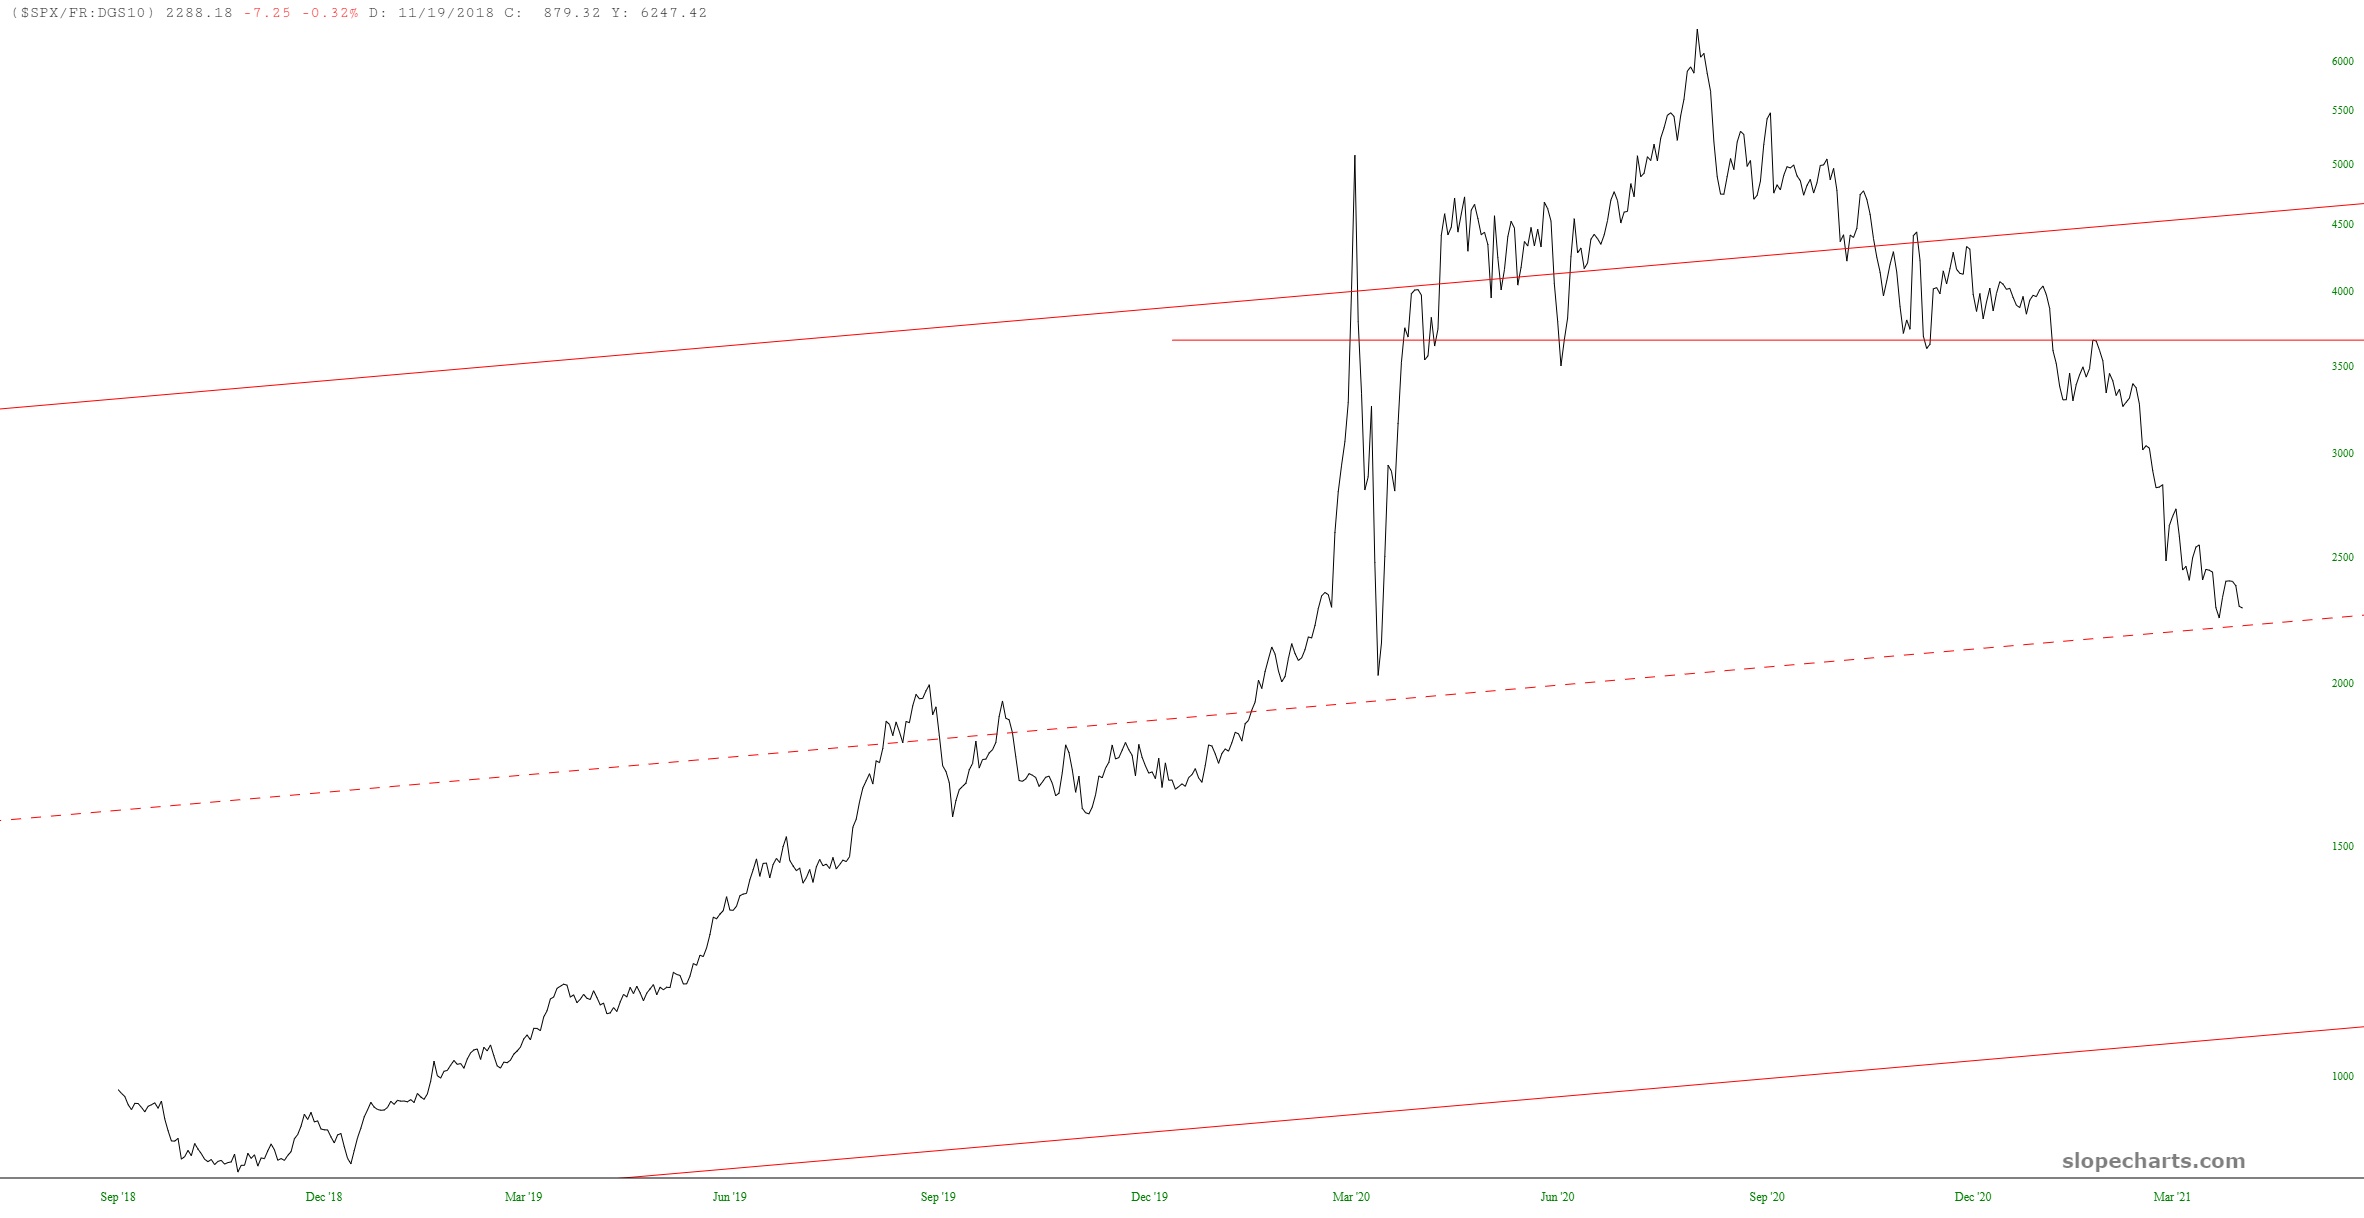
As you may recall, that is the S&P 500 cash index divided by the 10-year yield. It is a beautifully rendered ascending channel that goes back for the entirety of this risible dozen-years-long bull market.
What is striking is the midline of this channel, which was perfectly tagged quite recently. Should this suggest a bounce back up to the horizontal, it would require soaring stock prices and/or plunging interest rates.
(Click on image to enlarge)


Comments
Log in or sign up to join the conversation.