
The debate over the role of expectations in inflation determination gives me a sense of deja vu. That being said, it’s always useful to see what the data say when running a simple OLS regression on a basic expectations augmented Phillips curve (without a statement on forecasting, which often includes conditioning on future developments). I examine PCE inflation over the 1986-2021Q2 period.
Consider:
![]()
The left-hand side variable is the 4 quarter change in the log CPI. The value of coefficient on oil prices is the sum of four coefficients on 4 first differences of log oil prices. u-hat is the gap between observed official unemployment rate and what CBO now terms the noncyclical unemployment rate. (I am using CPI inflation expectations to predict PCE inflation; the former averages about 0.43 percentage points higher than the latter over this sample period.)
Using Michigan one year CPI inflation expectations:
![]()
Adj-R2 = 0.43, SER = 0.008, DW = 0.312, sample 1986Q1-2021Q2. Bold denotes significance at the 10% msl using HAC robust standard errors.
Using the Survey of Professional Forecasters median expectations:
![]()
Adj-R2 = 0.75, SER = 0.005, DW = 0.554, sample 1986Q1-2021Q2. Bold denotes significance at the 10% msl using HAC robust standard errors.
Inflation expectations come in with statistical significance in both cases. However, the estimated coefficients are well below unity (which one might expect in the simple expectations augmented Phillips curve). The Michigan survey coefficient is statistically significantly different from unity, while the SPF estimate is just significantly different at the 95% level. (By the way, one might expect a downward bias if the expectations proxy is measured with error, and uncorrelated with the other right hand side variables.)
How stable are these estimates? Using recursive 1-step ahead Chow tests, the Michigan survey-based equation exhibits breaks in 1996 and 2009 (at the 1% level). For the Survey of Professional Forecasters based equation, no breaks at the 1% level are detected, although several at the 5% level.
How “influential” are expected inflation proxies in determining actual inflation? One way to assess this is to scale the beta coefficients by standard deviations, to generate a “standardized beta”. One can then compare the standardized beta coefficient for expected inflation against those for the other variables.
For the equation using Michigan expectations, the standardized coefficient is 0.33, with the 1st, 2nd, and 3rd lag of oil price growth being slightly larger. When using the SPF median, the standardized coefficient is 0.67, much larger than any other coefficient (0.43 for the 3rd lag of oil price growth).
In some ways, this is not too surprising, given the the way expectations and actual inflation comove.
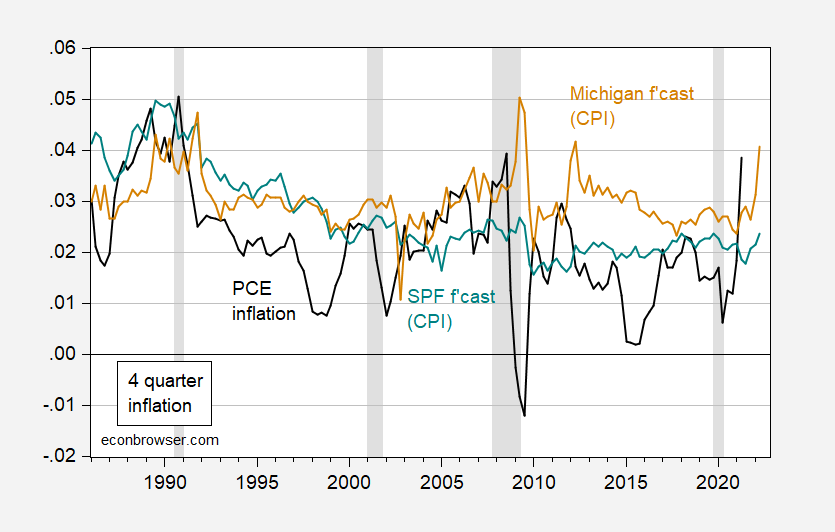
Figure 1: PCE price index inflation (black), Survey of Professional Forecasters median inflation (teal), Michigan Survey of Consumers (tan), all four quarter changes. Survey series pertain to date forecasted (i.e., 2022Q1 observation is the 2021Q1 forecast of 2022Q1 4 quarter inflation). NBER defined recession dates shaded gray. Source: BEA, MIchigan Survey, Philadelphia Fed/SPF, NBER and author’s calculations.
So, I think expectations (measured by survey data) are empirically linked to actual inflation outcomes. I’ve not established a causal link (which is for instance in the Friedman-Phelps story). Nor have I established that expectations measures would help in forecasting; that depends (at least in part) on other factors, including the extent and nature of measurement error.


Comments
Log in or sign up to join the conversation.