


JPMorgan (JPM) enters Q4 with analysts still broadly positive on the stock. The consensus remains around Moderate Buy, with targets near $368–$374. Analysts continue highlighting strong loan growth, resilient consumer activity, and solid net interest income. However, higher rates and softer deal activity could create more volatility during the quarter.
Looking ahead, analysts still see JPMorgan as one of the strongest large U.S. banks. Management expects full-year net interest income near $106 billion, while loan growth remains healthy. However, investment banking and fixed-income activity recently lost some momentum. Therefore, Q4 could bring consolidation before the larger growth story resumes into 2027.
Elliott Wave Outlook: JPM Weekly Charts August 2026
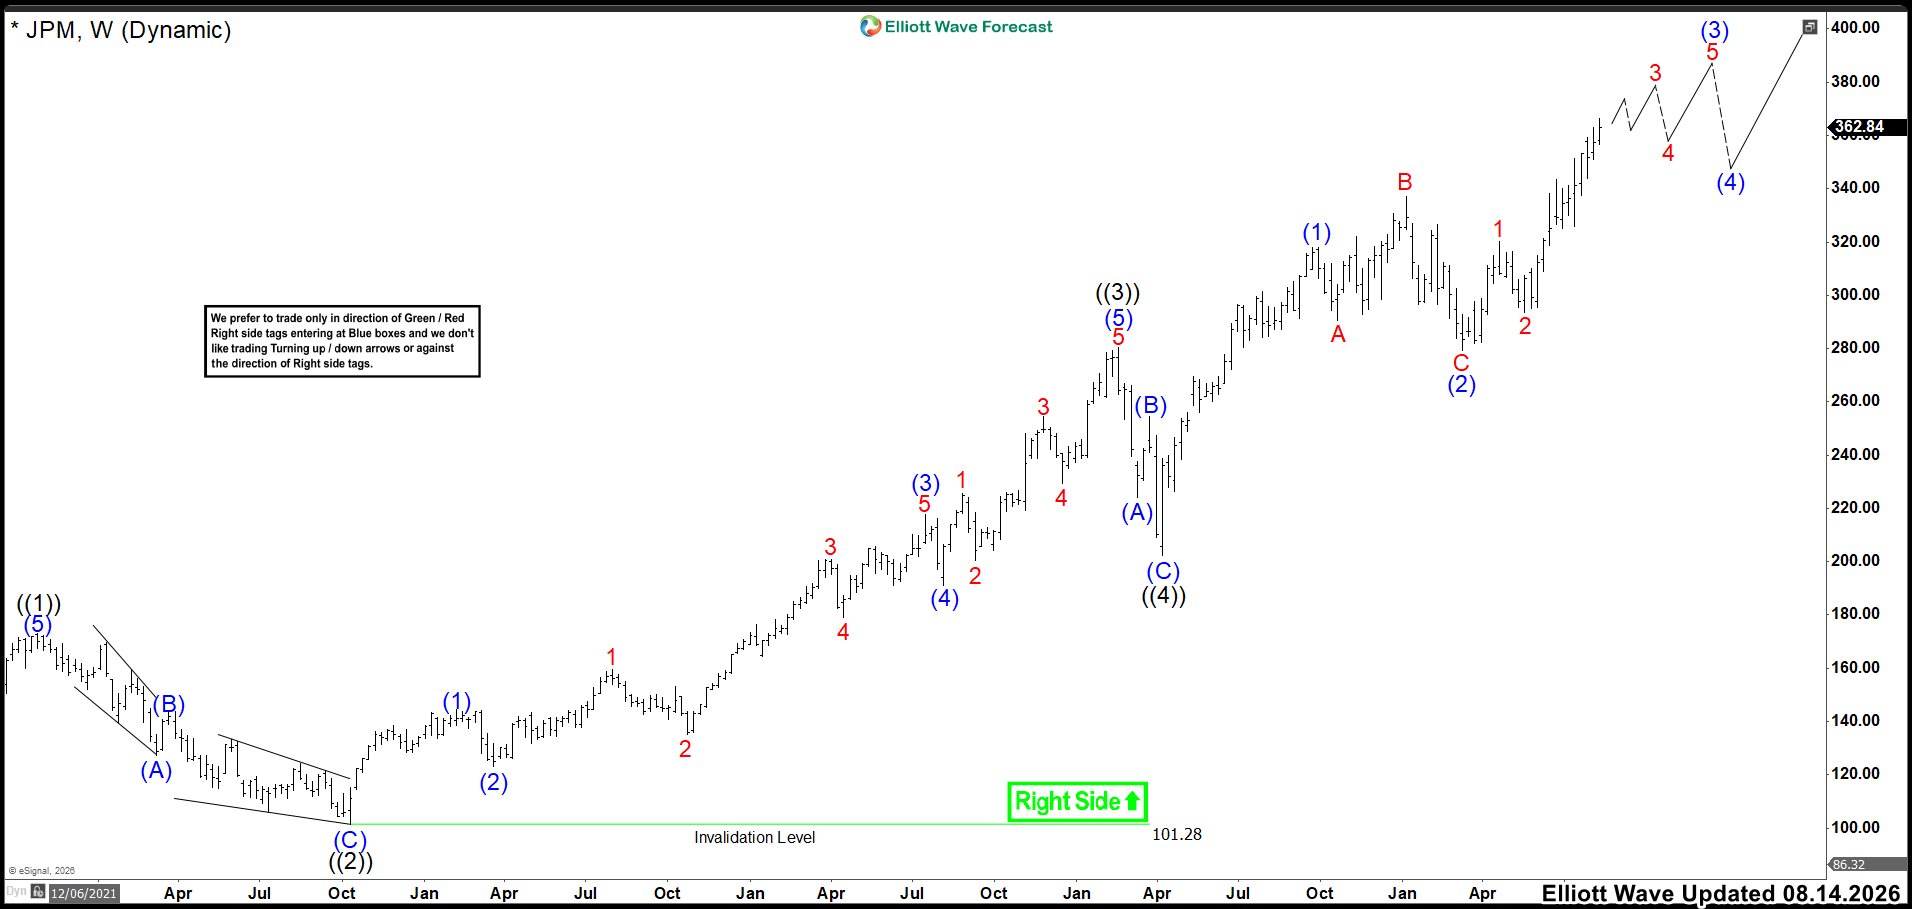
In August, JPM broke above wave B, confirming the extension of wave ((5)). Moreover, that breakout placed the market inside wave (3) of ((5)). From there, the bullish structure needed to remain above wave (2) to support further upside.
Additionally, we did not anticipate pullbacks similar to those seen during 2025. Instead, we looked for steady advances combined with periods of consolidation. Those consolidations should develop five waves and eventually complete wave (3) of ((5)).
Finally, we planned to recognize wave (3) as complete after a correction near ten percent. That decline should develop as wave (4) before another advance begins. Until then, our position remained on hold while the larger bullish structure stayed intact.
(If you want to learn more about Elliott Wave Principle, please follow these links: Elliott Wave Education and Elliott Wave Theory.)
Elliott Wave Principle Behind the Market Structure
Impulse
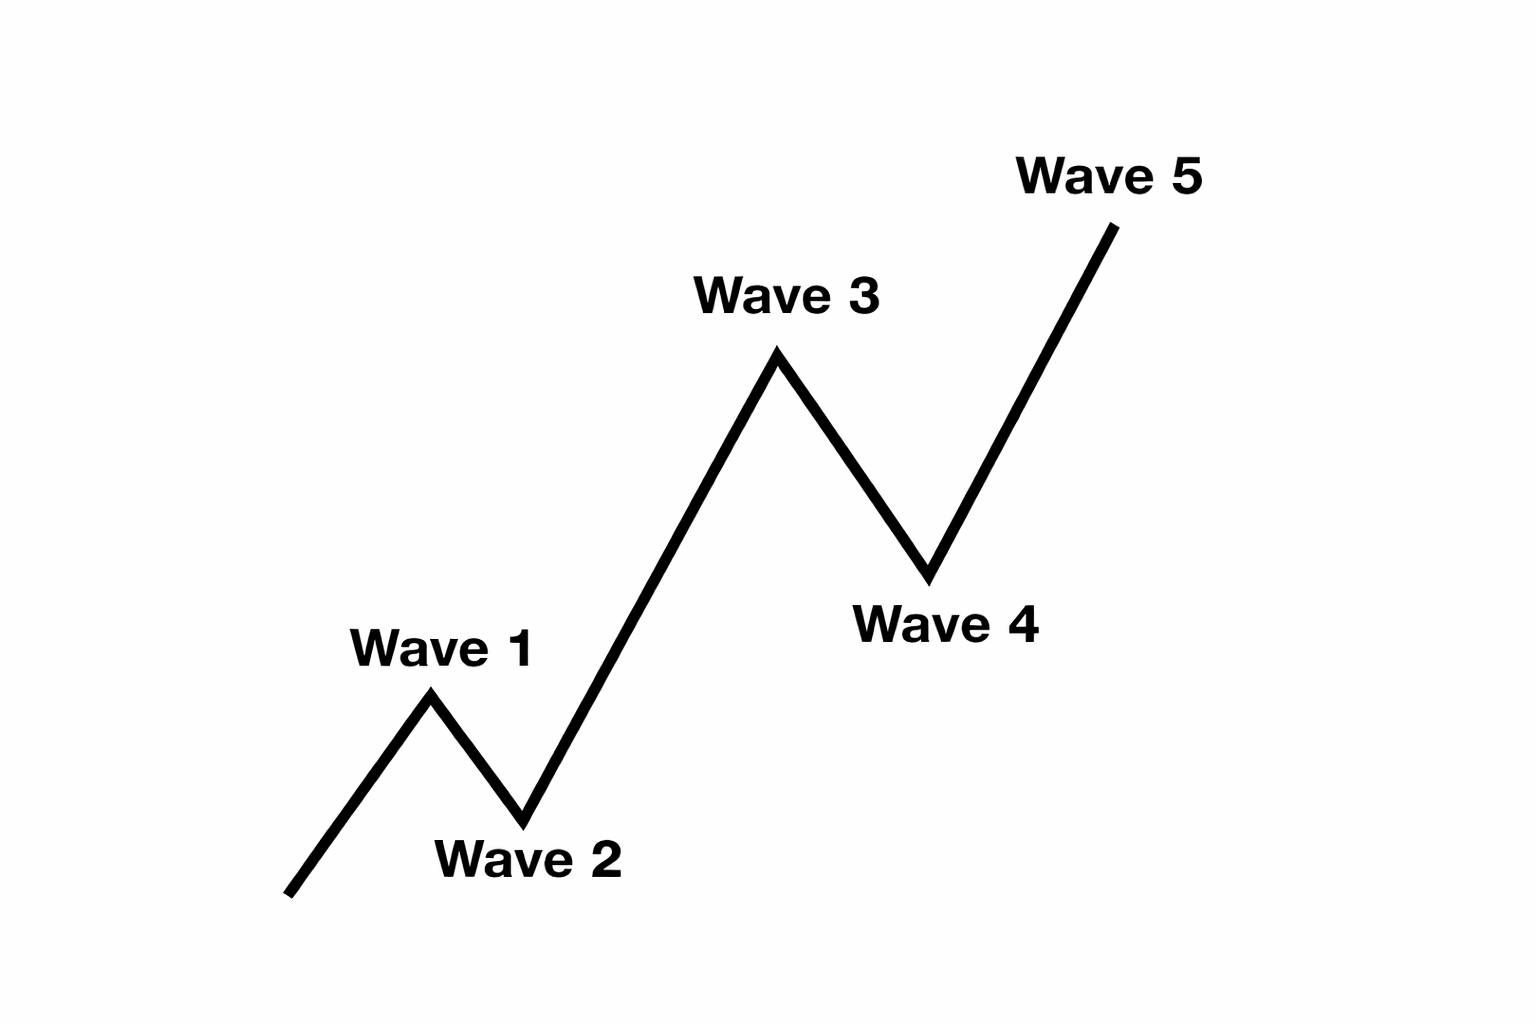
An impulse is a clean 5‑wave pattern that drives the trend forward.
Waves 1‑3‑5 are strong and directional.
No overlap between waves 1 and 4.
Wave 3 is usually the strongest.
Elliott Wave Outlook: JPM Weekly Charts October 2026
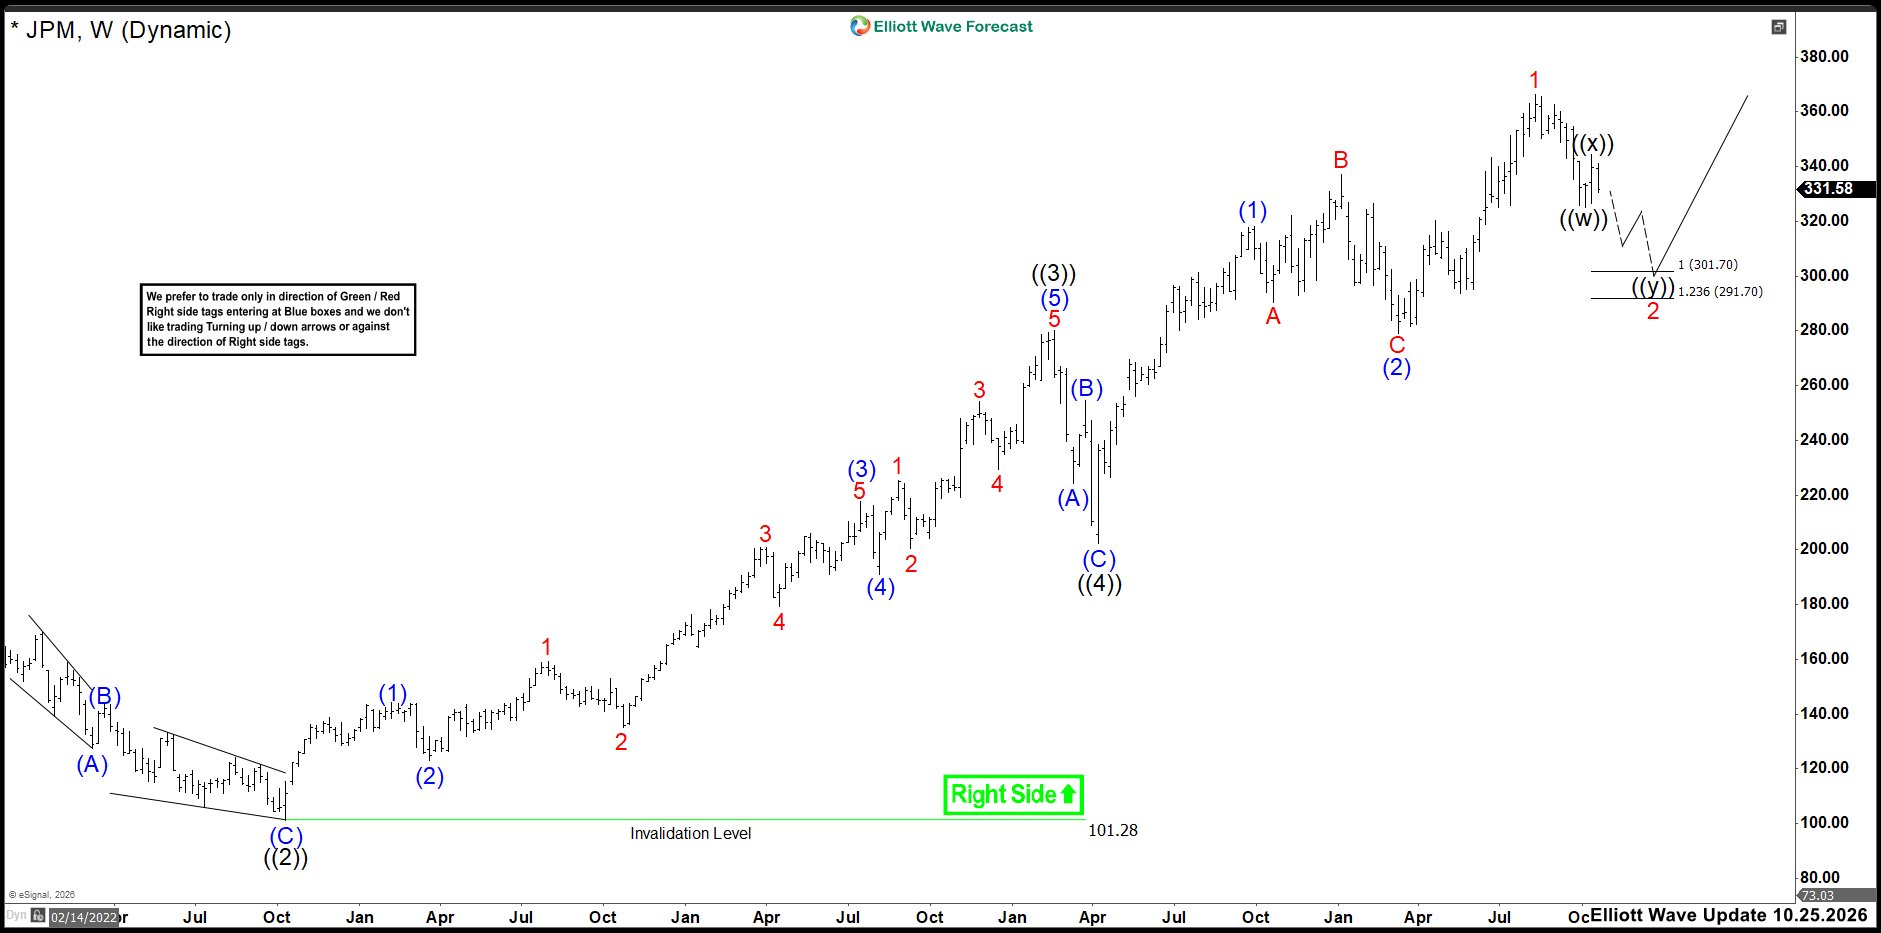
JPM remains in a strong long-term bullish cycle from the October 2022 low. The advance completed wave ((3)) before a corrective wave ((4)) ended near the April 2025 low. Since then, buyers have regained control, and the market has resumed the larger bullish sequence.
From the April 2025 low, JPM completed wave (1) and later corrected in wave (2). The next rally reached a new high near 365, completing another five-wave advance in wave 1. Currently, price appears to be correcting that rally in wave 2. The correction can develop as a double-three structure toward the 301.70–291.70 area. Afterward, buyers should return and push JPM toward new all-time highs.
However, we also need to consider an ending diagonal developing from the April 2025 low. This possibility would fit the final stages of the larger bullish cycle. For now, the structure does not provide enough evidence to confirm that scenario. We should learn more after JPM completes the current correction and breaks toward new highs. If the next advance develops with overlapping corrective subdivisions, the ending diagonal scenario will gain strength. Otherwise, a more impulsive structure should remain the preferred interpretation.



Comments
Log in or sign up to join the conversation.