

Hello fellow traders. In today’s technical blog, we will have a look at the JP Morgan (JPM) stock.
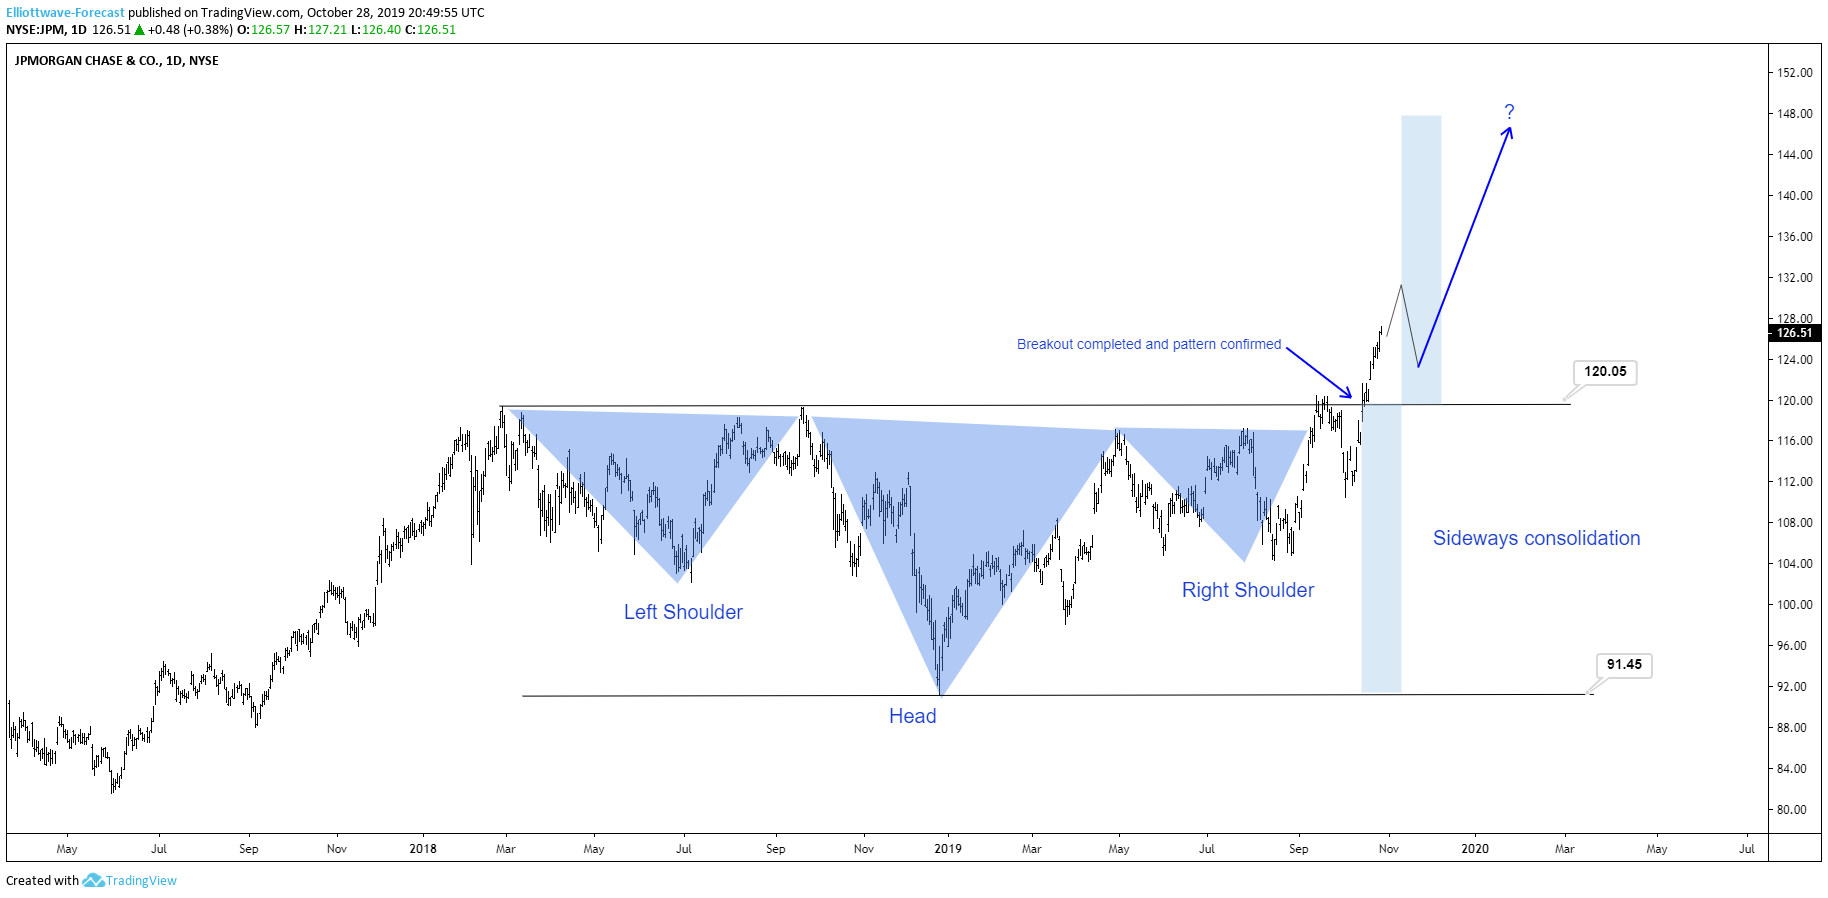
JPM has been in a big consolidation between 2018 and 2019. The stock was ranging from 91.45 low and 120.05 peak. It was just a matter of time that JPM would break out this range and start the dominant bull trend. During the consolidation between 2018 and 2019, the market formed a very nice technical pattern which is the inverse head and shoulders continuation pattern. With the recent breakout above 120.05 peak which confirmed the pattern the next extension higher has started. After breaking out, JPM accelerated nicely to the upside.
JPM 10.28.2019 Daily Chart
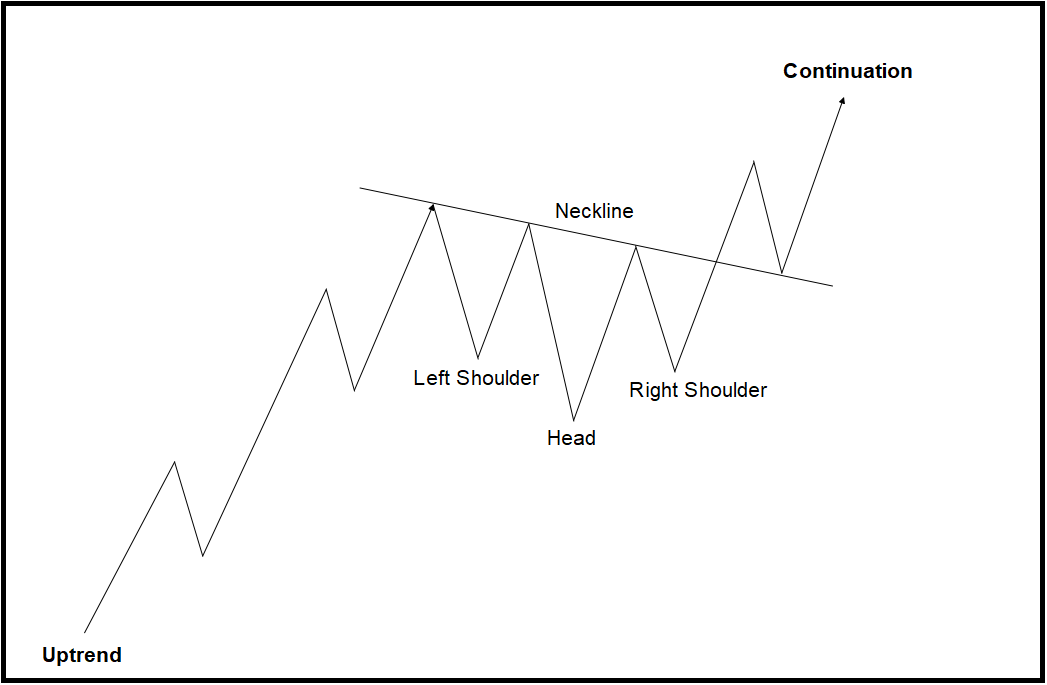
In the chart below you can see the illustration of the theoretical pattern. You can see that in the dominant trend, the inverse head and shoulders pattern is just a consolidation pattern to correct the previous trend. The confirmation comes with the break of the neckline. The potential target of this pattern is the length of the range projected to the upside. In the JPMt case, the potential target would come at around 144+ area. Please be aware that you need way more than the pattern to forecast the market but this shows yet again that the right side in the indices and consequently in individual stocks is to the upside.
Inverted Head & Shoulder Pattern (JPM)



Comments
Log in or sign up to join the conversation.