


Johnson & Johnson (JNJ) engages in research & development, manufacture & sale of range of products in the healthcare sector worldwide. It operates through Innovative Medicine & MedTech. It comes under the Healthcare sector & trades as “JNJ” at NYSE.
The JNJ favors a rally in a bullish sequence from the January 2025 low. Currently, it favors double correction lower in ((4)) & find support between $227.8 – $215.82 area to rally higher. Buyers will enter into that area for at least 3 swings bounce.
JNJ - Elliott Wave Latest Daily View:
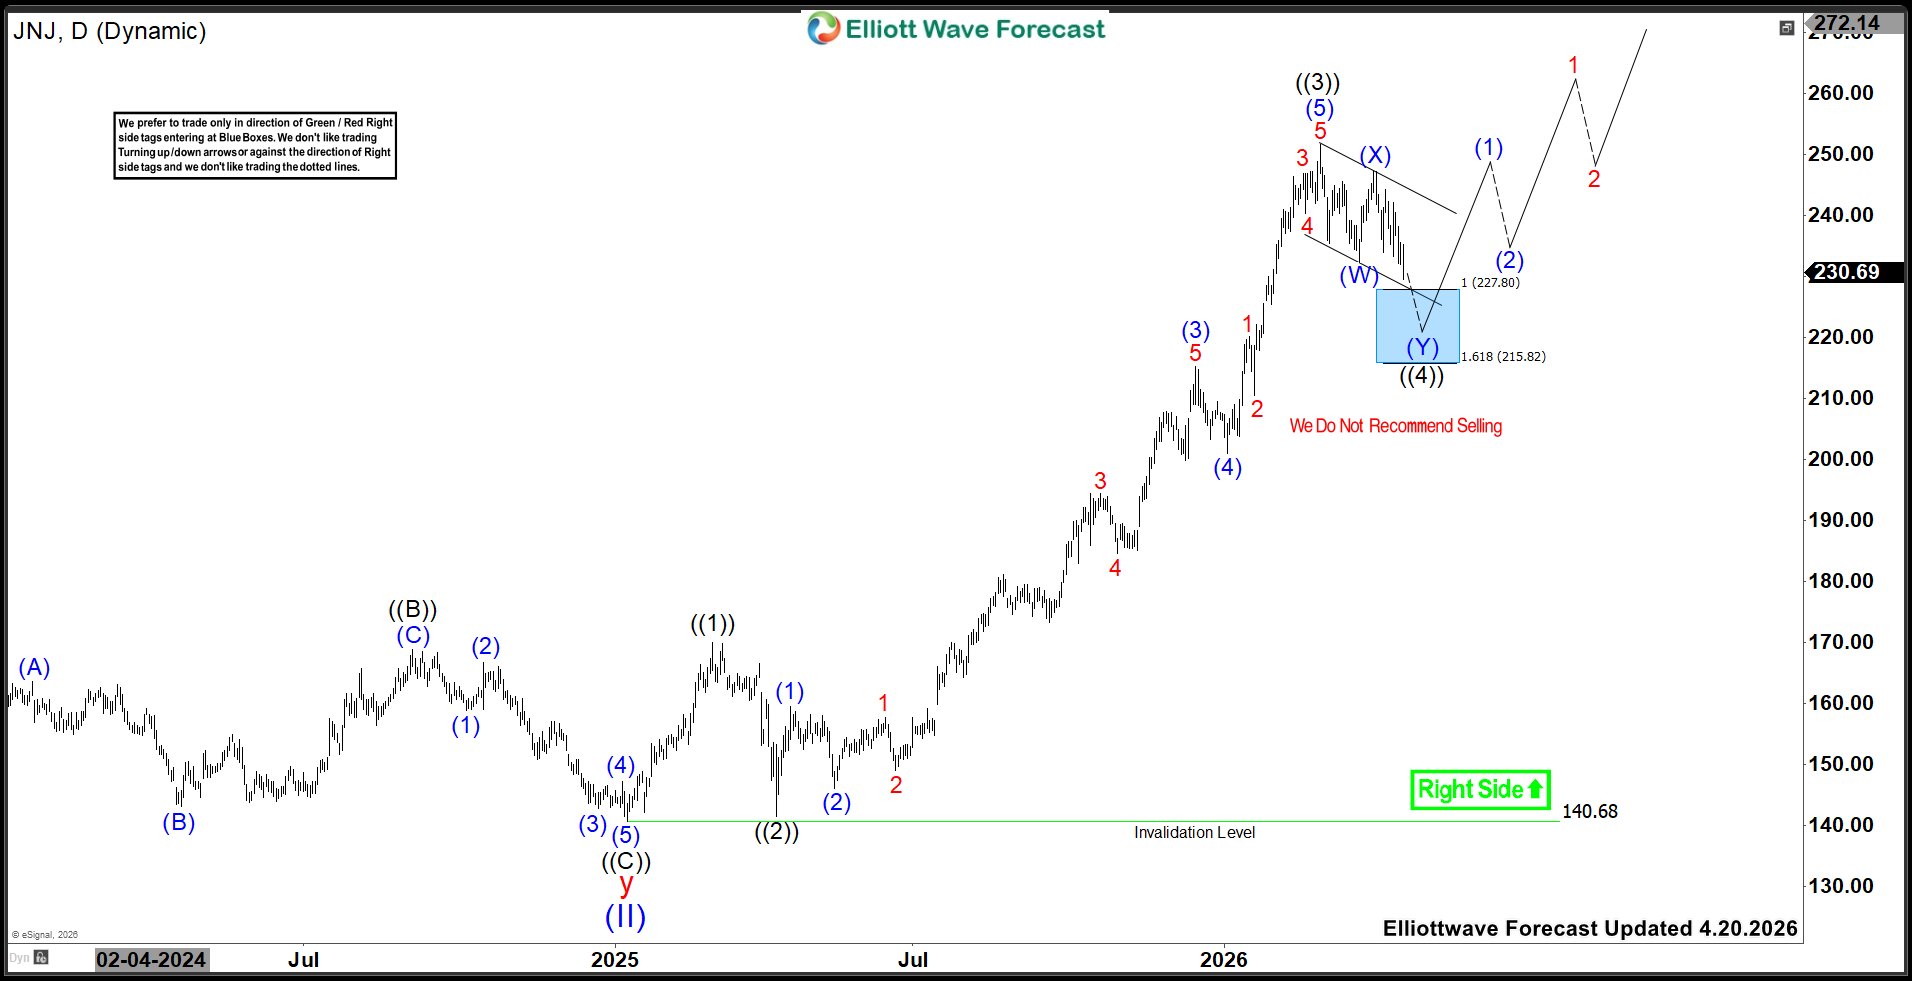
In weekly, it ended (I) impulse at $186.69 high in April-2022 & (II) correction at $140.68 low in January-2025. The pullback in (II) as choppy double three structure. Within (II), it ended w at $150.11 low, x at $175.97 high & y at $140.68 low. Above April-2025 low, it ended ((1)) of I at $169.99 high, ((2)) at $141.50 low, ((3)) at $251.71 high & favors a pullback in ((4)) in 3 or 7 swings (or triangle) correction. It is showing extended ((3)) sequence. In ((3)), it ended (1) at $159.44 high, (2) at $146.12 low, (3) at $215.19 high, (4) at $200.91 low & (5) at $251.71 high.
JNJ - Elliott Wave Daily View From 3.16.2026:
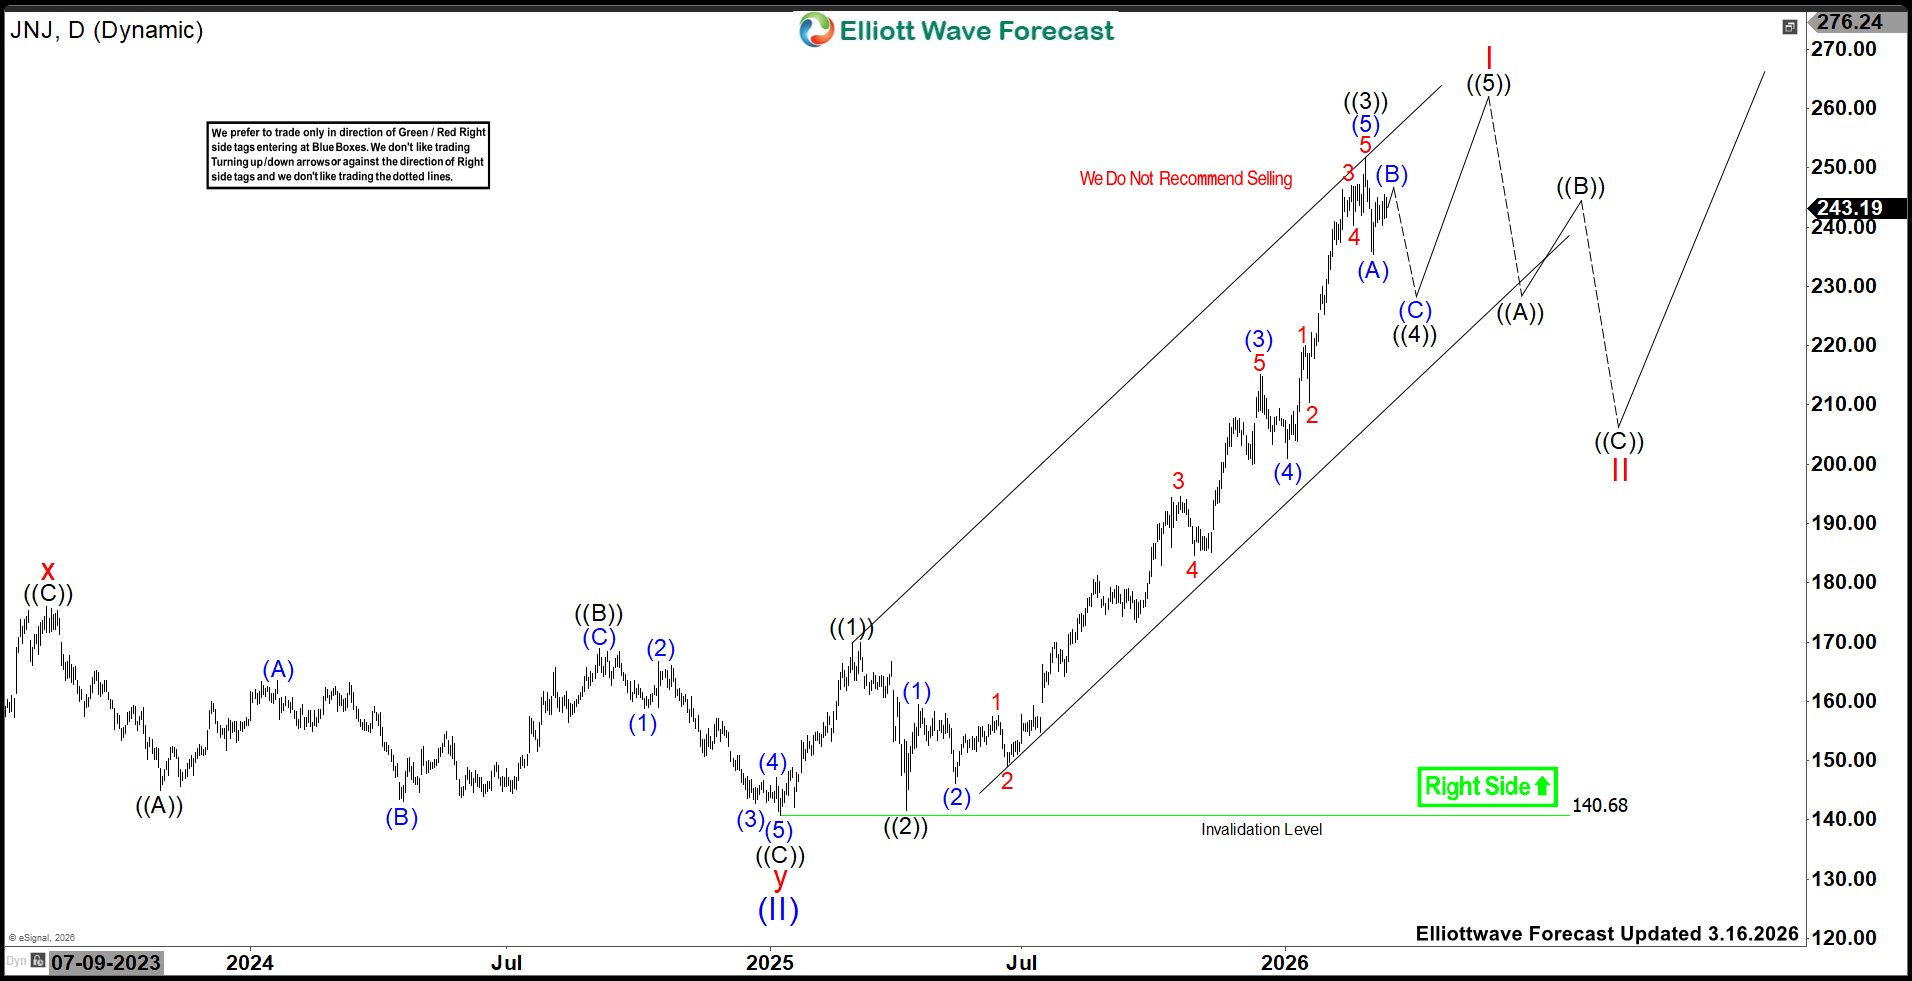
Below $251.71 high, it favors 7 swings pullback in ((4)) to correct against April-2025 low. In ((4)), it ended (W) in 3 swings at $232.24 low, (X) at $247.21 high & favors lower in (Y). It broke below (W) low, favoring downside into $227.8 – $215.82 area to finish ((4)). Buyers can look for a long entry in the blue box area for the next rally. Once it ends ((4)) in the blue box area, it expects a rally targeting above $259 to extend January-2025 sequence. We do not like selling it in any pullback as the overall bias is bullish & close to finding support.

Comments
Log in or sign up to join the conversation.