


🏛️ Market Brief – Stocks Shrug Off A 5% Treasury
The S&P 500 gained 1.2% this week to close at 7,744.64. That leaves the index up 13.1% for the year and just 0.7% shy of its August 13 record close of 7,798.99. While that is a bullish headline, the real story was in the bond market. The 10-year Treasury yield climbed from 5.01% last Friday to 5.18% on Thursday, then touched 5.225% intraday on Friday, the highest level since 2007 and a move of more than 20 basis points in a single week. Meanwhile, the 30-year hit 5.50%, the highest level since 2004. Bond volatility jumped too, with the MOVE index rising from 80 on Tuesday to 104 on Thursday.
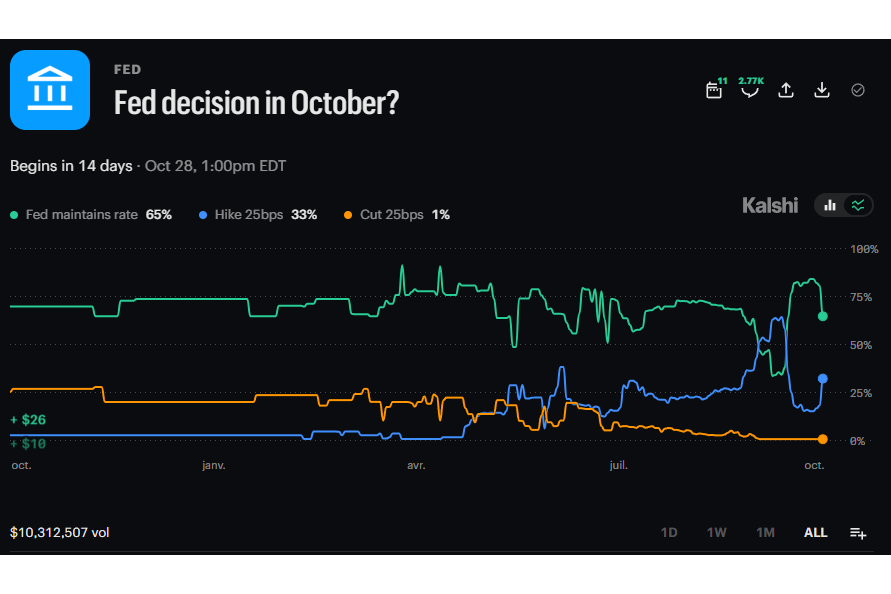
What pushed yields higher was an economy running hot. S&P Global’s flash composite PMI jumped to 58.4 in September from 56.0. Output grew at the fastest pace in more than five years. Initial jobless claims also fell to 197,000, near levels last seen in the late 1960s. Markets now price roughly a 70% chance the Fed hikes again in October, up from about 50% a week ago. In other words, the same strength that supports earnings is pushing the discount rate higher.
Consumers tell a different story. The University of Michigan’s final September sentiment reading fell to 48.1, a four-month low. Year-ahead inflation expectations rose to 4.6%, up from 3.4% before the Iran conflict, and gasoline near $4.50 a gallon is doing that damage. Crude offered some relief on Friday. WTI fell to $91.96 as U.S. and Iranian officials discussed reopening the Strait of Hormuz, but Brent still hovered near $100.
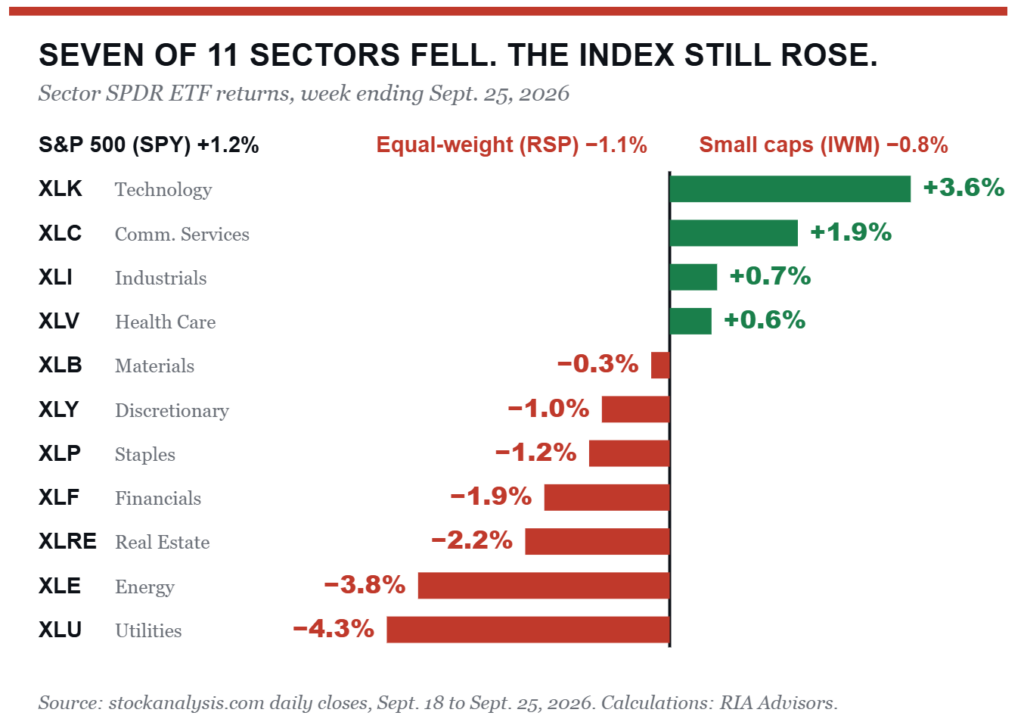
Under the surface, the week was narrow. Technology gained 3.6% and communication services added 1.9%, while utilities fell 4.3% and energy dropped 3.8%. Seven of 11 sectors finished lower, and the index still rose because technology carried it. Meanwhile, the equal-weight S&P 500 fell 1.1% against a 1.2% gain for the cap-weighted index. Small caps slipped 0.8%, and real estate lost 2.2%. Such is what a 5% “risk-free” rate does to the rate-sensitive corners of the market.
Earlier this month, in September Market Weakness: The Setup Has Teeth, we warned that late September is historically the weakest stretch of the year. The weakness showed up, just earlier than the calendar suggested. From its September 3 close, the index fell 2.5% to the September 16 low of 7,551.81. It has since rallied 2.6% off that low. So far, the back half of the month has been the stronger half, which isn’t what the seasonal data pointed to.
The thread to follow next week is simple. Stocks have ignored the bond market for two weeks. Wednesday’s PCE report and Friday’s payrolls will test whether they can keep doing so.
📈Technical Backdrop – Momentum Turns Up, Breadth Doesn’t
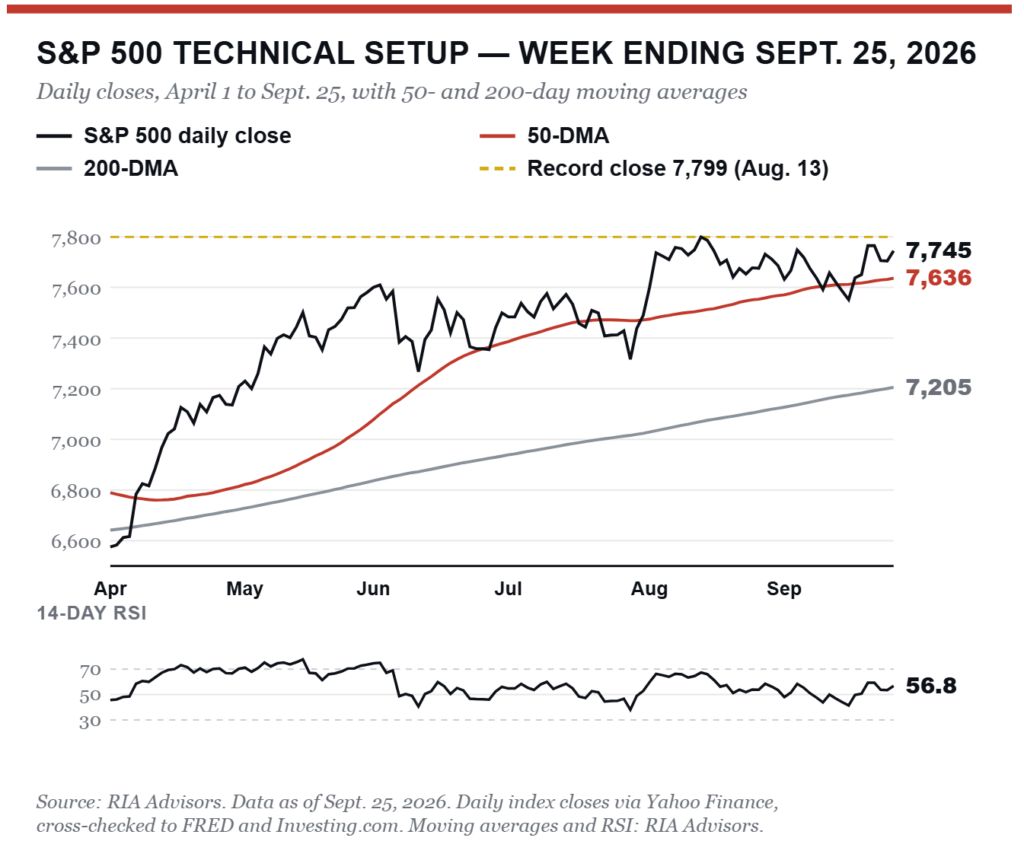
The S&P 500 closed Friday at 7,744.64, up 1.2% for the week. It sits 1.4% above its 50-DMA at 7,636 and 7.5% above its 200-DMA at 7,205. The 20-DMA at 7,673 is rising just beneath the price. Since early August, the index has traded in a range between roughly 7,550 and 7,800 on a closing basis. Friday’s close put it back near the top of that range, less than 1% below the August 13 record. Holding near the highs while the 10-year pushed above 5.2% is constructive price action.
The week itself did most of its work on Monday. The index jumped 1.5% as AI names rallied and oil eased, gave back 0.75% on Wednesday as yields spiked, then added 0.5% on Friday. Buyers stepped in on each dip, and that matters. A market that refuses to break on bad news usually has more upside left.
Momentum improved meaningfully. The 14-day RSI climbed to 56.8 from 50.7 a week ago, neutral territory with plenty of room before overbought. The MACD crossed back above its signal line on Monday. It now reads +18.9 index points against a signal line of +10.8. That’s the first MACD buy signal since August 3, and it argues for a test of the record high. Resistance is well defined, though. The upper Bollinger Band sits near 7,791, almost exactly on top of the record close, so the 7,790 to 7,800 zone is where sellers are most likely to show up.
Here’s the problem. Price momentum improved while participation narrowed. The equal-weight index fell 1.1% this week as the cap-weighted index gained 1.2%. Small caps slipped 0.8%, and seven of 11 sectors finished lower. A rally led by one sector can run for a while. It’s fragile, though, because if technology stumbles there’s very little underneath to catch the index. The flip side is that the laggards are exactly where a broadening move would have to come from. Utilities and real estate were the most beaten-up groups on the week. They’re also the most sensitive to rates, so any pullback in yields would likely spark a sharp rotation into both.
The bond bears will say stocks can’t keep ignoring a 5.2% 10-year. They may be right eventually. The tape hasn’t agreed yet, and until it does, the trend deserves the benefit of the doubt.
For traders, the playbook is relatively straightforward. Don’t chase the index into the 7,790 to 7,800 zone. A closing break above 7,800 would open the 7,900 to 8,000 targets we laid out earlier this month. Pullbacks toward the 50-DMA near 7,640 are where we’d look to add exposure. On the other hand, a close below the September 16 low of 7,551.81 would break the range and put the 200-DMA near 7,205 in play. We continue to recommend rebalancing technology winners back to target weights into the current strength. Too much of this week’s gain came from a single sector.
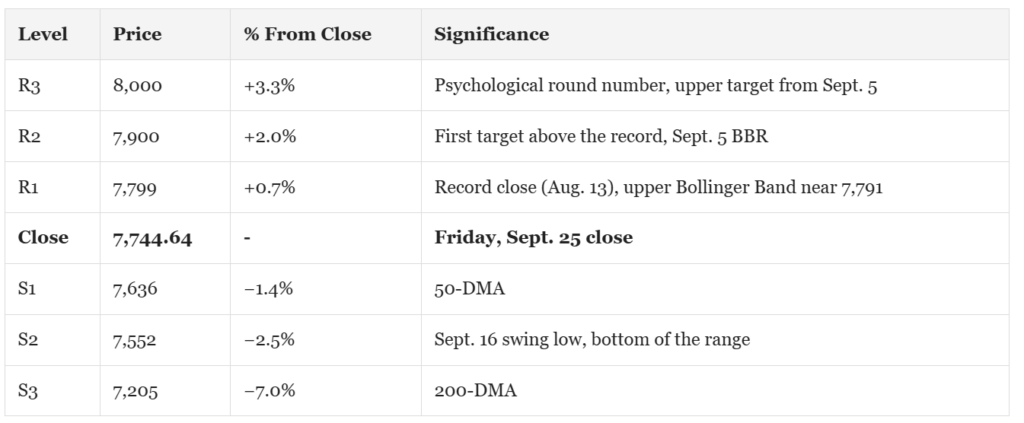
The single level to watch next week is 7,800. A close above it confirms Monday’s MACD signal. A failure there, with breadth this narrow, keeps the index stuck in its range.
🔑 Key Catalysts Next Week
Next week’s data will go a long way toward deciding whether the Fed hikes again in October. Markets price roughly a 70% chance of a quarter-point move at the October 27 and 28 meeting. That puts two reports at the top of the list: Wednesday’s PCE inflation data and Friday’s September payrolls.
Wednesday brings August PCE, the Fed’s preferred inflation gauge, alongside personal spending and the final read on second-quarter GDP. Consensus expects core PCE to rise 0.2% for the month and GDP to hold at 2.1%. ADP’s private payroll estimate lands the same morning, with consensus at just 38,000.
Friday’s jobs report is the bigger event. Consensus looks for 162,000 new jobs, unemployment steady at 4.1% and hourly earnings up 0.3%. JOLTS on Tuesday and ISM Manufacturing on Thursday, expected at 54.6, round out the picture. A hot core PCE and a strong payroll print would all but lock in an October hike. With the 10-year already above 5%, that’s the combination stocks are least prepared for.
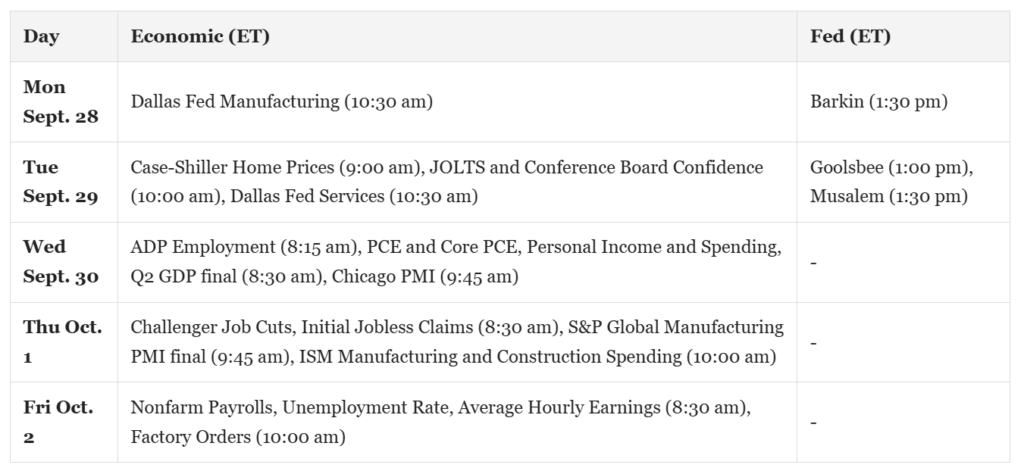
On the Fed side, Richmond’s Tom Barkin speaks Monday. Chicago’s Austan Goolsbee and St. Louis’s Alberto Musalem follow on Tuesday. Listen for whether any of them push back on the October pricing.
Beyond the data, watch the U.S. and Iranian talks over the Strait of Hormuz. A reopening would pull crude lower and ease the inflation expectations the Michigan survey flagged. A breakdown would do the opposite, pushing Brent further above $100 and dragging yields up with it.
Earnings stay light until third-quarter reporting season starts in mid-October, and FactSet already expects 28.9% growth for the quarter, so the bar is high. Accenture (ACN) reports before the open Thursday, and Nike (NKE) follows after the close. Accenture is a read on AI-driven consulting demand. Nike is a read on the same consumer the Michigan survey says is losing confidence. Wednesday also marks quarter-end. The S&P 500 is up 3.3% for the quarter while long bonds have sold off, so pension rebalancing could lean toward selling stocks and buying bonds.

The most market-moving event is Friday’s payroll report. A soft print is the bigger surprise. As we noted this week, CTAs hold the largest duration shorts since April. A weak jobs number could force them to cover, sparking a sharp bond rally that pulls yields lower and hands the rate-sensitive laggards the relief they need after a brutal week.
💰 Jefferies Sets 9000 Target For Market: Everything Must Go Right
In this week’s Daily Market Commentary, we flagged the growing chorus calling for 9,000 on the S&P 500. The most detailed version comes from Jefferies, which now sees 9,000 by the end of 2027. With the index closing at 7,764.64 on Tuesday, that’s another 15.9% from here. Jefferies isn’t alone, either. FactSet’s bottom-up analyst target sits even higher at 9,261. In a matter of weeks, the S&P 500 9,000 target went from a bold call to the “consensus” view. That’s exactly why it deserves a closer look.
What Jefferies’ S&P 500 9,000 Target Actually Assumes
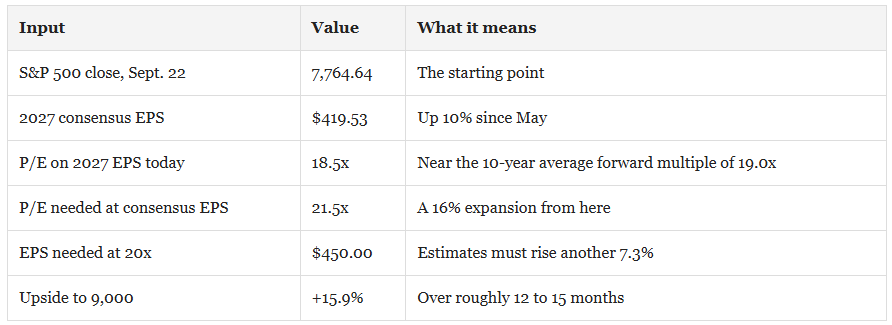
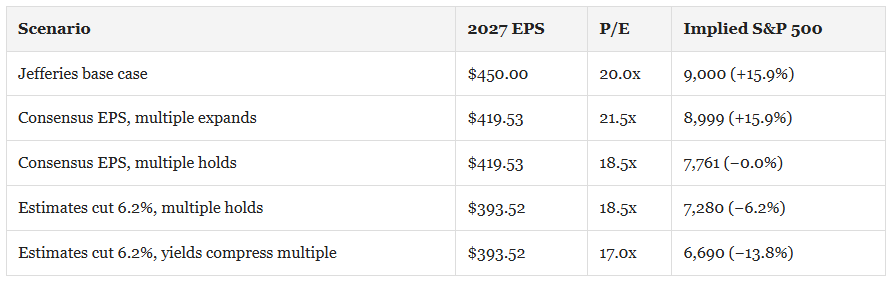
Jefferies’ price target of 9000 certainly is encouraging, until you strip away the headlines and focus on the math. Price equals earnings times whatever investors will pay for those earnings. Jefferies spells out its math plainly: $450 in 2027 earnings per share at 20x. That assumes 20.8% earnings growth next year, on top of a 2026 estimate of $373 that already sits above the Street. Its bear case is 6,900, and its bull case is 10,500.
However, this is where it gets interesting. Consensus 2027 earnings currently sit at $419.53, up 10% from roughly $381 in May. At Tuesday’s close, the market trades at about 18.5 times that number. Getting to 9,000 requires either a 16% expansion in the multiple or another 7% of upward revisions on top of the ones we’ve already had. Neither is impossible. Both require the current trend in estimates to keep running, and that’s the assumption worth testing.
The Drivers Are Real, And They’re Breaking A 90-Year Trend
Let me be clear about this: the bulls have the data on their side right now. According to FactSet, analysts expect S&P 500 earnings to grow 31.8% this year and 15.2% in 2027, on revenue growth of 9.1%. Net margins hit 17.0% in the second quarter, the highest since FactSet began tracking in 2009. Jefferies estimates that AI-exposed companies account for about 46% of index earnings, with growth of 60% this year slowing to 24% next year. Goldman puts AI infrastructure at roughly half of all S&P 500 earnings growth across 2026 and 2027.
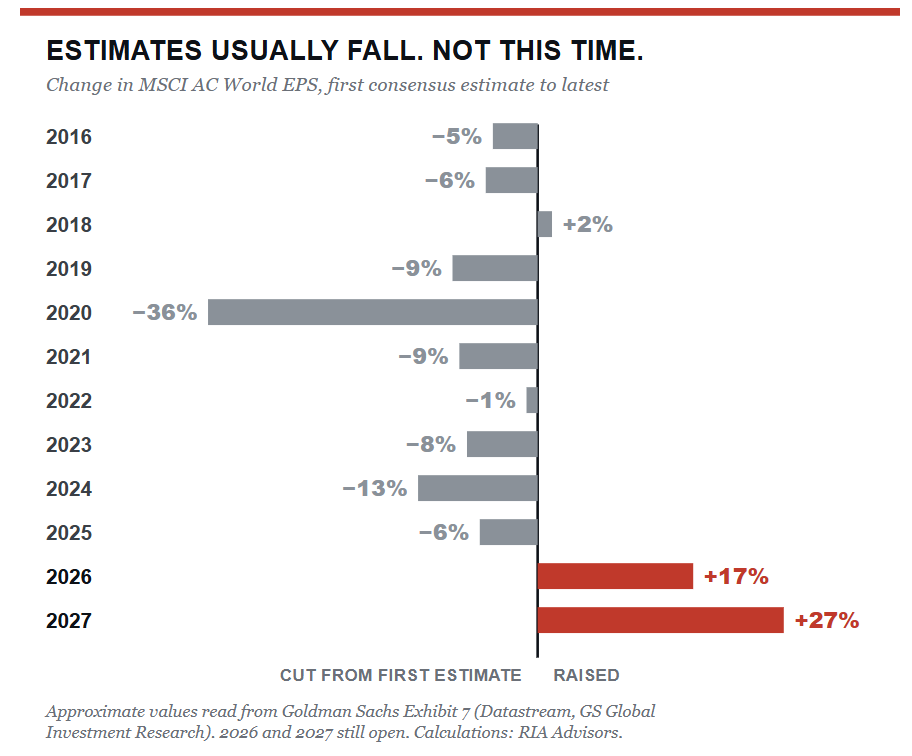
The more unusual part is the direction of the revisions. Wall Street almost always starts a year too optimistically and spends the next 24 months cutting. Goldman’s chart of global earnings estimates clearly shows that. From 2016 through 2025, the final number landed below the first estimate in eight of ten years, and the other two were roughly flat. The 2026 and 2027 estimates are doing the opposite, running up roughly 17% and 27% from where they started. Such is the fuel behind every 9,000 targets on the Street. It’s also the thing that has historically reversed with the least warning.
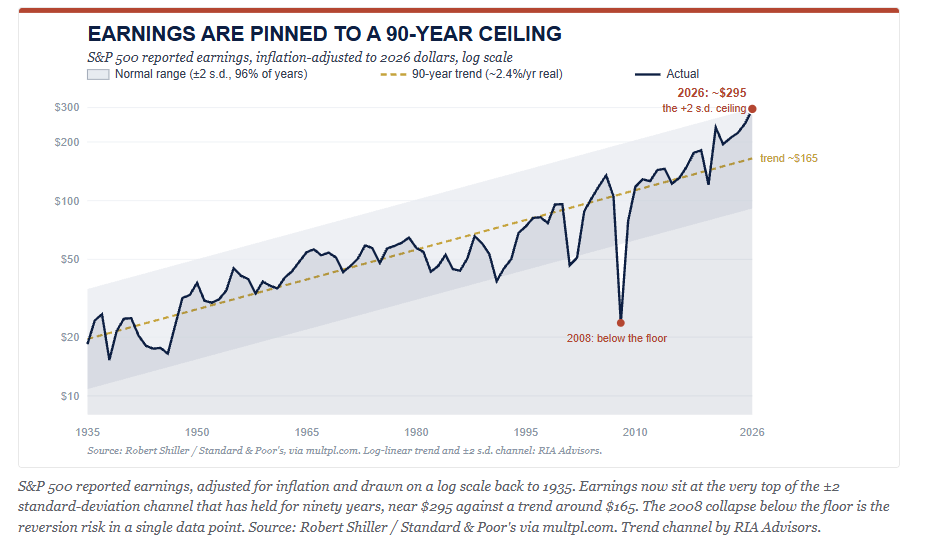
That push higher matters because of where earnings already sit. Two weeks ago, in This Time Is Different? Earnings And Price Break 90-Year Trends, we showed that corporate earnings had broken above a trend that had contained them for more than 90 years.
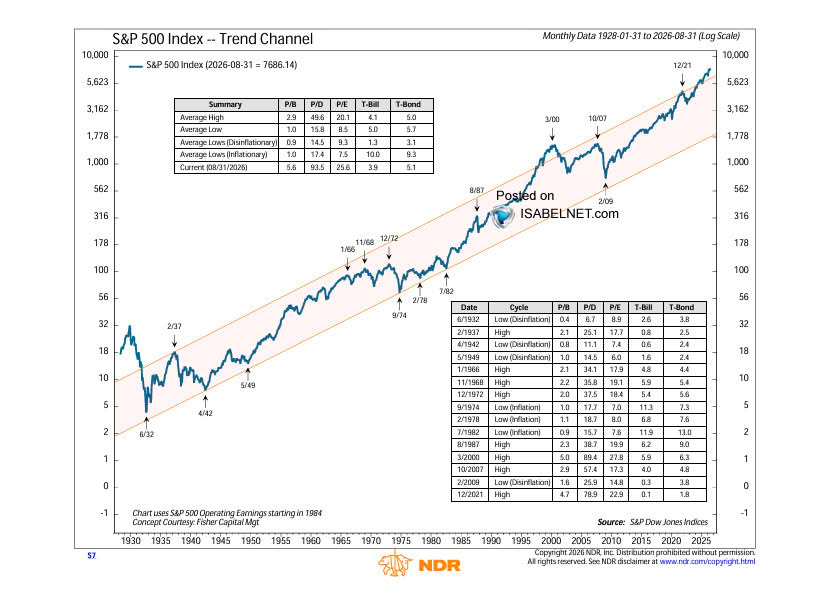
The S&P 500 also pushed above the upper limit of its long-term price channel, a level last reached in early 2000.
Our work on earnings mean reversion put forward estimates close to 50% above their long-term growth trend. Jefferies’ $450 takes that gap to roughly 60%, and every upward revision widens a gap that has historically closed on the earnings side.
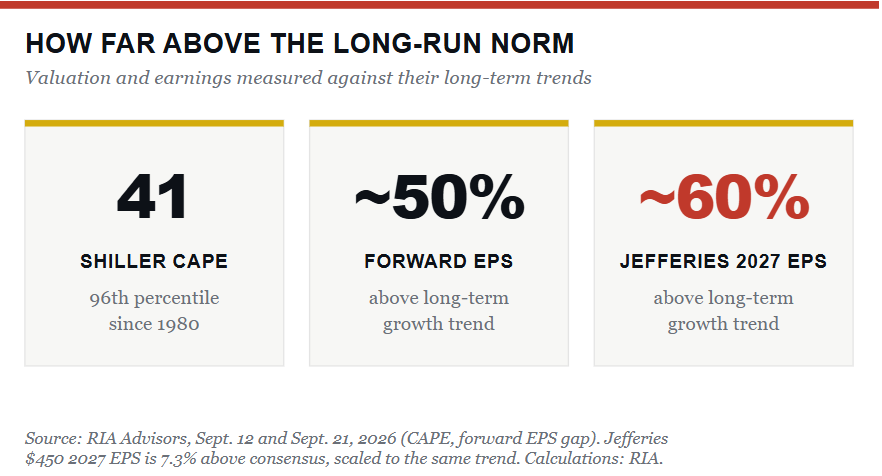
To wit, from that 90-year analysis:
“Whatever event causes the ‘E’ to revert towards its long-term mean, the ‘P’ will be repriced lower.”
Here’s What Could Undercut The Outlook
Someone will tell you the analysts have been right all year, so why fight them? That’s a reasonable point. The issue is NOT whether earnings grow in 2027. They almost certainly will. The issue is whether they grow 15.2% while the market is already priced for it.
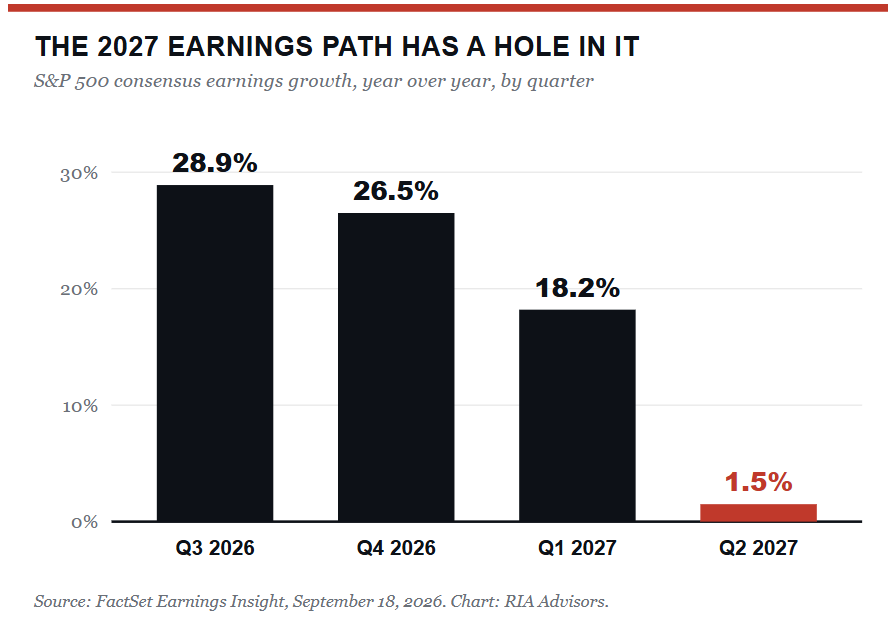
Let’s start with the shape of next year’s path. As of this writing, the consensus forecast has fourth-quarter earnings growing 26.5% and first-quarter 2027 earnings growing 18.2%. However, the second quarter drops to 1.5%. To hit the full-year 15.2%, the back half of 2027 has to average something close to 20% growth, at a point when the easy year-over-year comparisons are gone.
Secondly, margins are potentially problematic. FactSet already expects net margins to slip from 17.0% to 15.0% in the third quarter, against a five-year average of 12.4%. The 9,000 forecast needs margins to hold near a record, and records are where margins tend to mean-revert.
The third risk is how the AI buildout is being paid for. FactSet tracks hyperscaler capex near $800 billion this year, with free cash flow at or below zero for every major spender except Alphabet (GOOGL) and Microsoft (MSFT). Borrowing has risen from 9% of capex to 32%. As we discussed in AI Capex Depreciation Risk Is The Catch To Record Earnings, those servers are being depreciated over 5 to 6 years.
However, what if their real useful life is closer to 3 or 4? In that case, a much larger depreciation charge lands squarely in 2027 earnings. Then there’s the consumer. Brent crude traded near $98 on Tuesday, up from $72 before the war in Iran started, and year-over-year crude consumption has already turned negative. That series has closely tracked real personal consumption, suggesting higher energy costs are eating into broader demand.
The Fed Isn’t Coming To The Rescue This Time
Over the last fifteen years, investors learned that the Fed would cut if earnings stumbled. That reflex is gone. The FOMC raised rates by a quarter point to a target range of 3.75%-4.00% on September 16, and the vote was unanimous. Chair Kevin Warsh said the move “will deliver a timelier return to our target.”
As we noted in Another Hike By Year End And No Cuts On The Horizon, the median dot now sits at 4.1% for both 2026 and 2027. In other words, one more hike this year and no cuts until 2028. The Summary of Economic Projections has core PCE inflation at 3.4% this year.
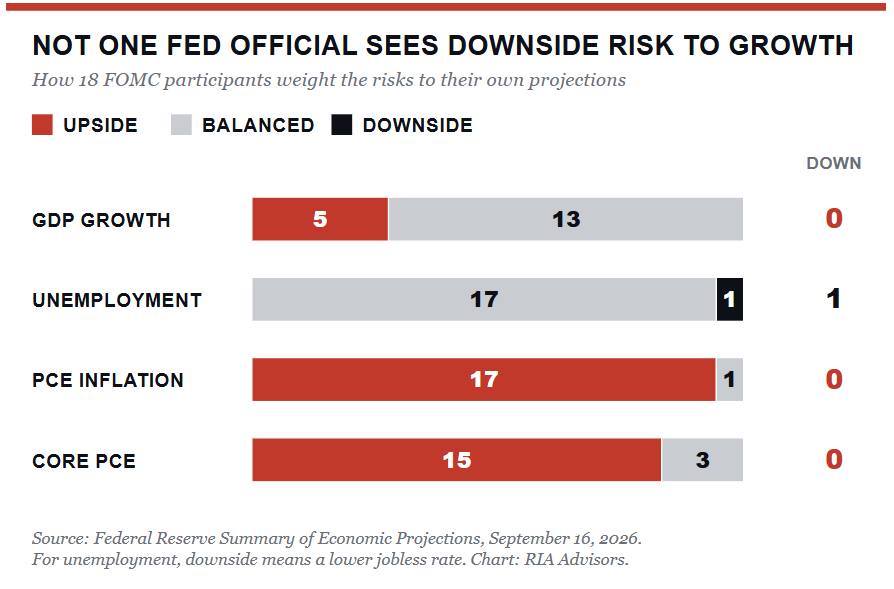
Look at how the committee sees the risks. Not one of the 18 participants sees growth weighted to the downside. Seventeen see inflation risks weighted to the upside. Such is the setup Bob Farrell’s Rule #9 warns about: “When all the experts and forecasts agree, something else is going to happen.” As we showed in the DMC, a coin flip has matched the committee’s 12-month forecasting record since 2012. A committee this confident about growth and this worried about inflation isn’t positioned to deliver “rate cuts” quickly if earnings disappoint.
Rates are the other half of the valuation equation. The 10-year Treasury closed at 5.11% on Wednesday, the highest since 2007. The speed matters as much as the level. Goldman notes that stocks tend to struggle once the 10-year moves by about 30 basis points in two weeks or 50 basis points in a month. It’s up 28 since September 9 and 37 since August 21. The Russell 2000, where rates bite first, fell 1.8% on Wednesday.
FactSet’s forward P/E of 19.1 implies forward earnings near $400, an earnings yield of about 5.2%. Against a 5.11% 10-year, investors are being paid roughly 8 basis points to own stocks rather than Treasuries. At that premium, even 2027 consensus earnings need a 10-year near 4.6% to reach 9,000. The 6.2% cut in the table below is the average amount by which analysts have overshot final earnings, including recessions.
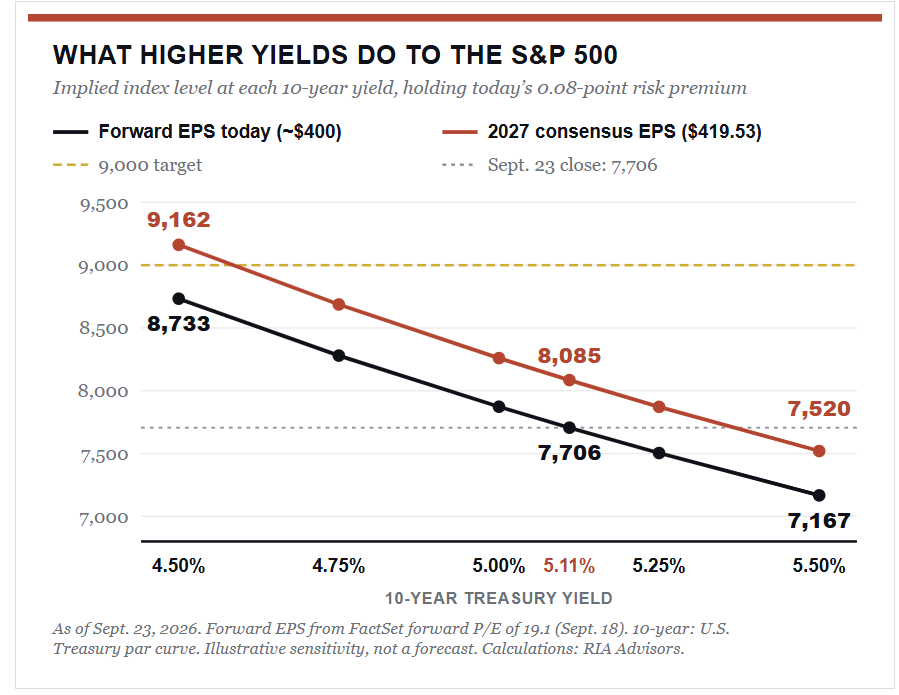
We can do some simple math and calculate implied S&P 500 returns based on various 2027 EPS levels and valuation multiples. As shown, math can become fairly brutal.
What Should Investors Do Now
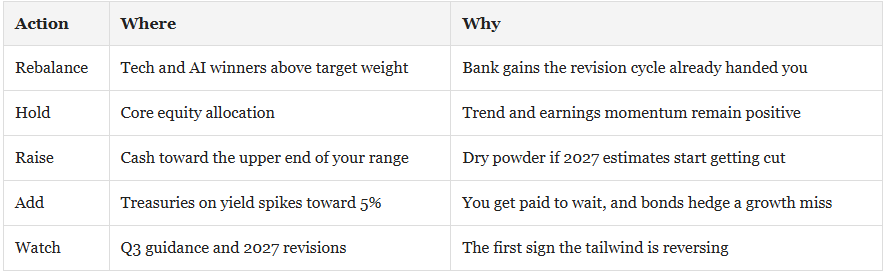
None of this makes me bearish on the next few months. The trend is bullish, the index sits within a fraction of its record, and earnings momentum is positive. Fighting that tape has been a losing trade all year. What bothers me is how little room for error the S&P 500’s 9,000 target leaves. It needs estimates to keep rising, margins to stay at records, AI spending to keep paying off, and rates to stop climbing, all at the same time. That’s a lot of things that have to go right for another 15.9%, against a downside of 6% to 14% if only one or two of them go wrong.
This is why we continue to recommend staying invested while increasing the risk controls and discipline around the portfolio. The goal is to capture potential market appreciation if Jefferies’ 9,000 target is achieved, without building a portfolio that depends on it. Practically, here’s how that looks.
Markets rarely punish investors for missing the last 15% of a bull market. They punish investors who needed that 15% to be there.
As we wrote two weeks ago, position for the trend and prepare for the bend. Right now, the forecasts have stopped leaving room for anything to go wrong.
They usually do right before something does.
📊 Market Statistics & Analysis
Weekly technical overview across key sectors, risk indicators, and market internals
💸 Market & Sector X-Ray: Market Gains Ground
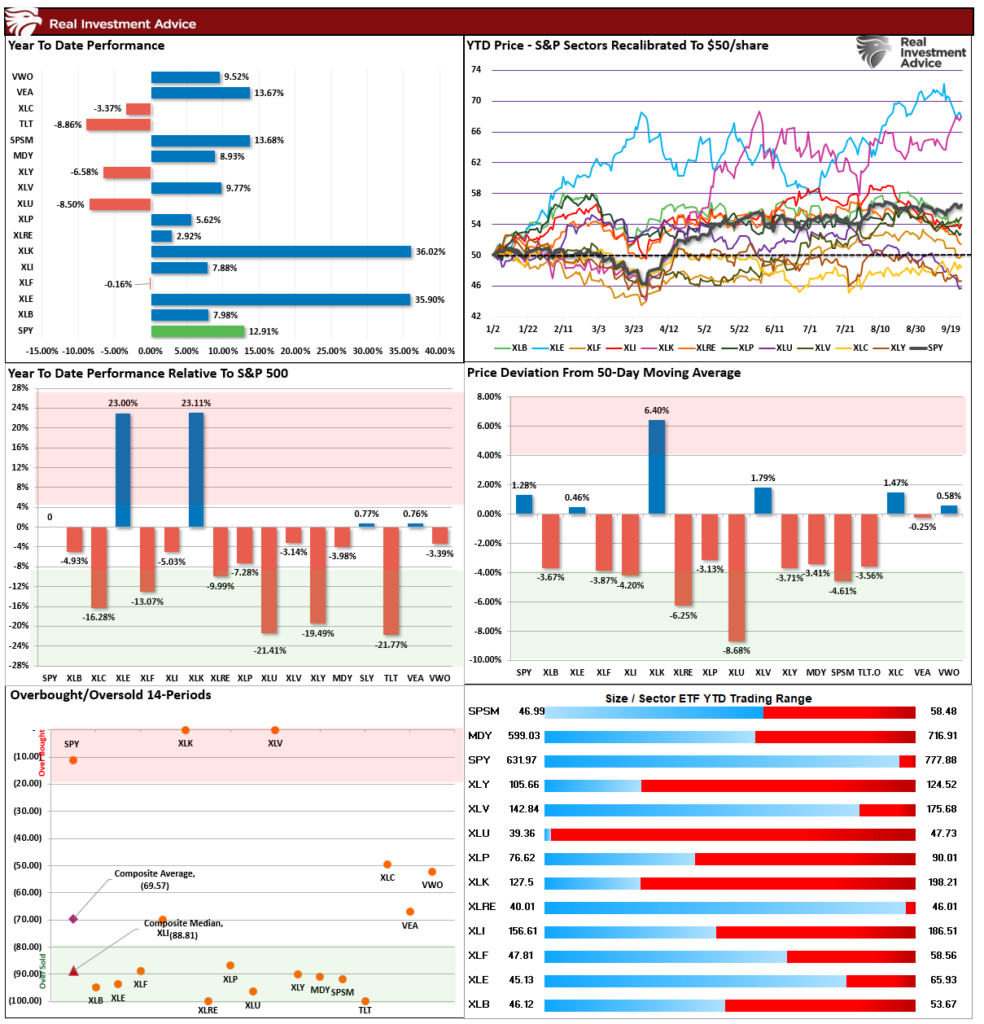
The market rose this past week as September continues to play out to form. Technology gained ground, offsetting weakness in the rest of the market. With Technology extremely overbought and everything else either approaching or at more oversold levels, a rotation is likely.
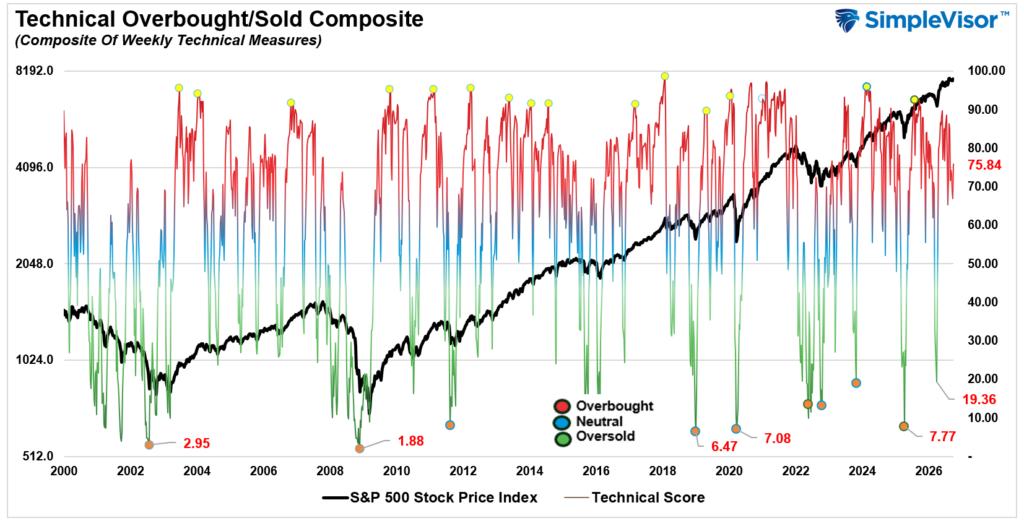
📐 Technical Composite: 75.84 – Increased Slightly, Still Overbought
The technical condition increased somewhat this past week as the market rallied. However, overall, the market remains technically overbought, and sentiment remains mostly bullish for now with no significant technical breaks. The indicator does suggest more struggles for the market next week.
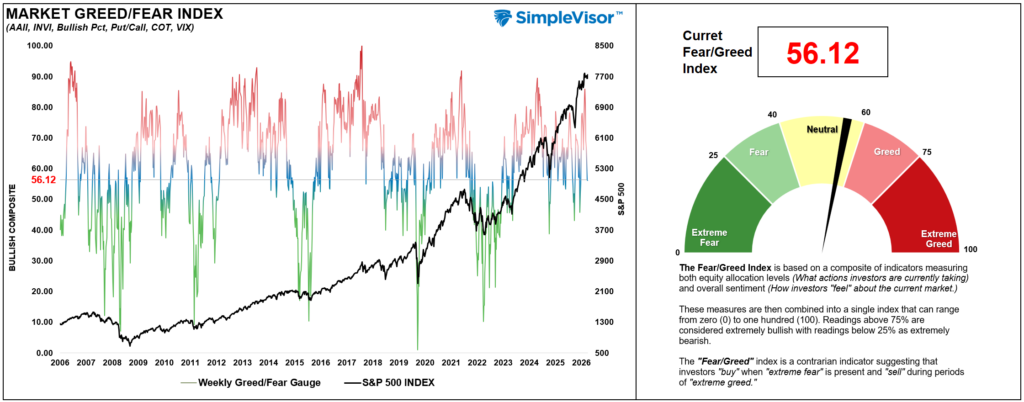
🤑 Fear/Greed Index: 56.12 – Investor Bearishness Increases
Even though the market rose a bit last week, the underlying market allocation and sentiment remained mostly stable. There was a continued drop in the Commitment of Traders equity allocations, and investor sentiment turned slightly more bearish last week. If the market can continue to hold up amid increasing bearishness, it could present a good buying opportunity over the next month or so.
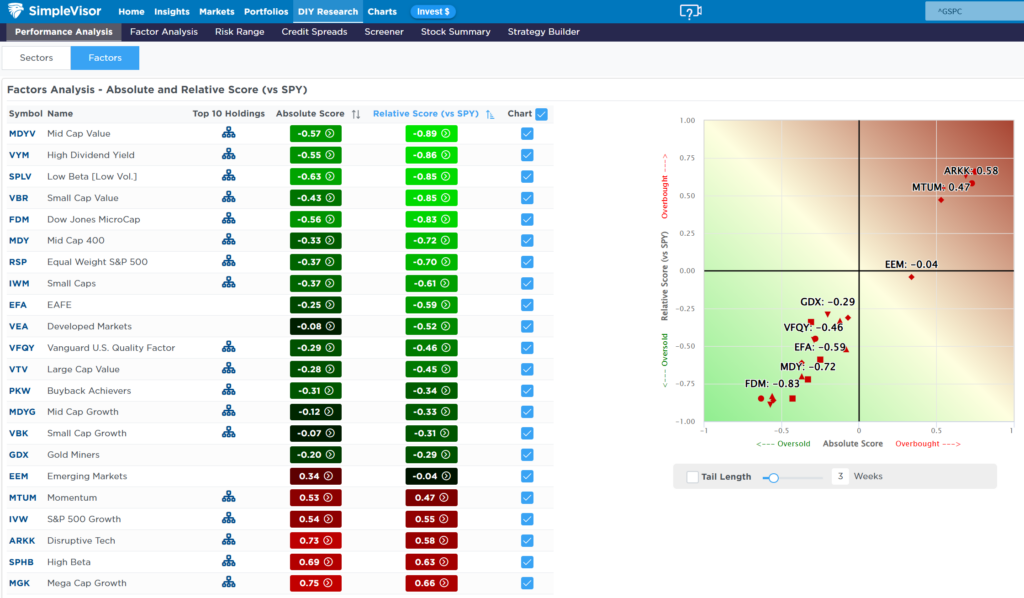
🔁 Relative Factor Performance
Factor performance has diverged over the last couple of weeks, with Growth, Speculative Technology, and Megacaps now extremely overbought, while Value, Low Beta and Dividend Yield (interest rate sensitive sectors) now the most oversold. A risk-off rotation from seems highly probable. As noted below, this is a “risk aware” market currently and increasing controls seems logical.
📊 MFBR Index (Money Flow/Breadth Ratio Indicator)
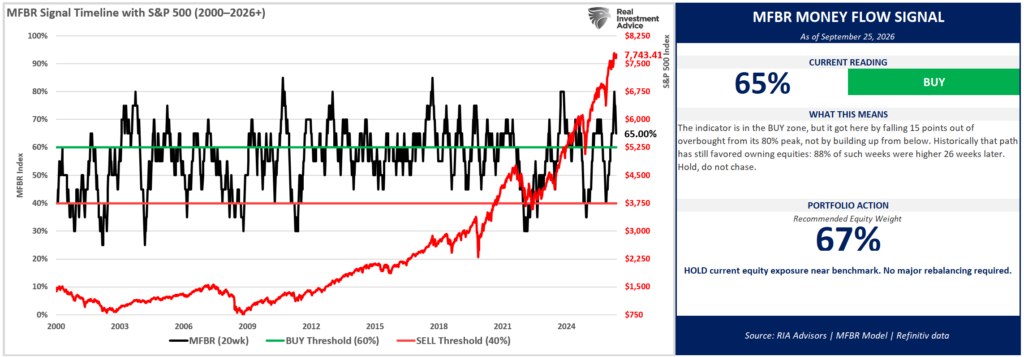
The Money Flow Breadth Ratio (MFBR) model is a rules-based equity allocation framework that uses weekly S&P 500 money flow data to generate buy, sell, and neutral signals. The MFBR systematically adjusts portfolio equity exposure in response to the direction and persistence of institutional capital flows. It aims to reduce drawdowns while capturing the majority of market upside.
“As of September 25, 2026, with the S&P 500 at 7,743.41, the Money Flow Breadth Ratio (MFBR) stands at 65%, down from a peak of 80% set 6 weeks ago and flat versus 65% the prior week. The trailing four-week change is still -10 percentage points, but the near-term trend has rolled over. This places the indicator in BUY territory (60-70%). The raw zone signal reads BUY, but the model still flags a TOP REVERSAL, with 15 points now off the peak. Read that BUY as a zone label, not as fresh confirmation – the model reached this band by falling out of overbought, not by building up from below.
Bottom line: hold the target weight. The roll-over off the 80% peak is real and worth watching, but it has carried the gauge into the band that has historically been the best place to own equities. This is neither a chase nor a de-risk. A sustained break below 60% would move the grid to an underweight; a move back above 70% would re-engage the contrarian trim.”
📊 Sector Model & Risk Ranges
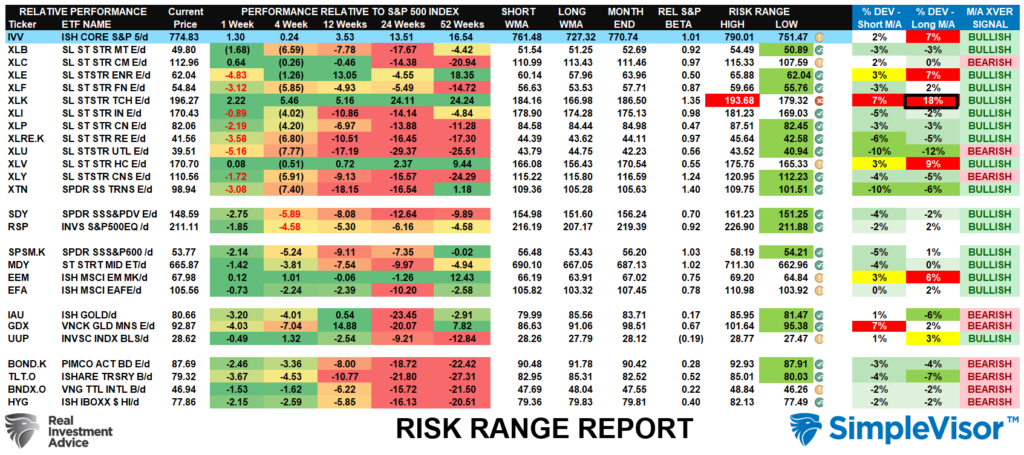
Six weeks ago, we noted that several sectors of the market were hitting extremes, which typically denotes a good opportunity to reduce risk and rebalance holdings. That has remained good advice as the Fed hiked rates this past week and the market continues to consolidate within a small trading range. Energy, Technology, and Goldminers are the most deviated from their long-term means and should be rebalanced to target. Bonds are extremely oversold, and if there is a risk-off rotation, we could see money flow into bonds.

Comments
Log in or sign up to join the conversation.