


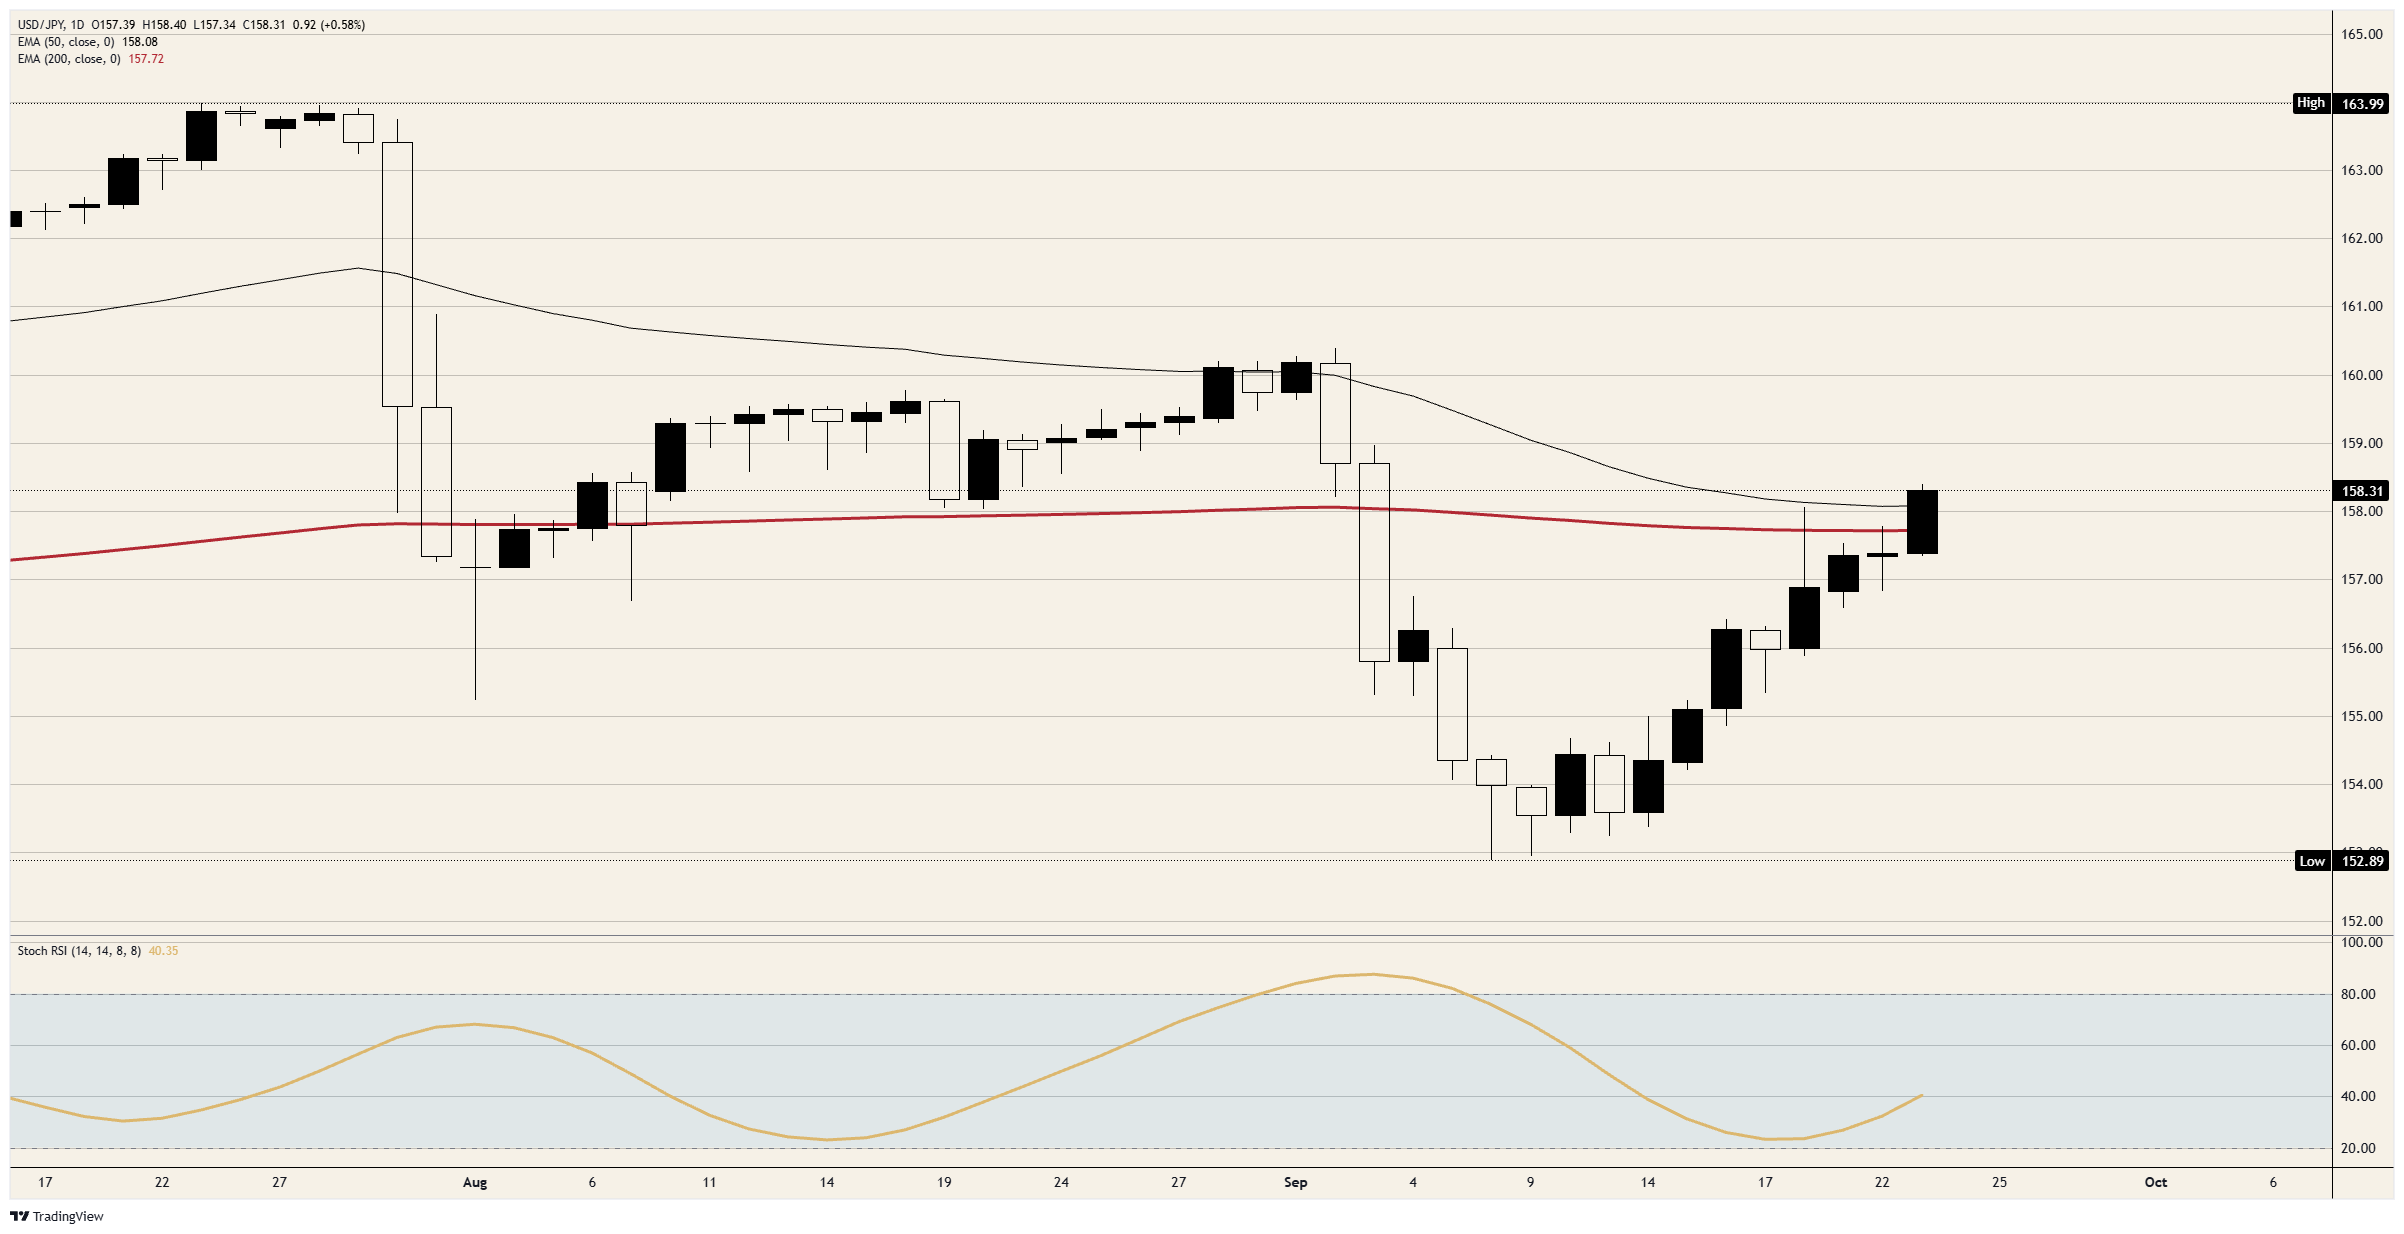
Holding up the Yen is costing Japan more each time and working for less time. USD/JPY is trading above 158.00, on track for its first daily close above its 200-day average since September 2.
Japan's Finance Ministry bought ¥15.4 trillion of Yen between July 30 and August 26, more than the ¥11.7 trillion it spent in April and May, and the US Treasury joined in on July 31. The most Japan has ever spent in a month on its currency kept USD/JPY under 160.00 for four weeks.
Japan's rate hike takes effect with the Yen weaker than on decision day
The Bank of Japan (BoJ) raised its rate to 1.25% on September 18 in a 7-2 vote, the highest since 1995, and the new rate applies from Thursday. The Fed is at 3.75-4.00%, and Fed Governor Barr argued for more increases on Wednesday. Borrowing Yen at 1.25% to hold Dollars earning close to 4% still pays.
US Treasury Secretary Bessent said on September 8 that he knew more about the BoJ's next move than traders did, and USD/JPY hit its September low near 153.00 that same day before recovering nearly three-quarters of the drop.
All of the Yen's losses since Friday came during a Japanese holiday
Japanese markets have been shut since Monday for national holidays and reopen on Thursday, the day the new BoJ rate starts. Japanese officials checked exchange rates with dealers on September 18, the step that usually comes before Japan buys Yen, and the July buying began with USD/JPY near 164.00. Tokyo's dealers return on Thursday to a USD/JPY above anything it traded on the day of that check.
Levels and bias
Resistance: Wednesday's high short of 158.50 is the first cap. Above that, 159.00 is where USD/JPY traded for most of late August, and 160.00 is where the early-September drop started.
Support: 158.00 turned from cap to floor on Wednesday. Below it, the 200-day Exponential Moving Average (EMA) just above 157.50 had capped every daily close since September 2, and 157.00 is the next level down.
Bias: Long above 157.50, aiming at 159.00 and then 160.00. The daily Stochastic Relative Strength Index (Stoch RSI) climbed to near 40 and is still rising, well short of overbought. A daily close back under 157.00 ends the long.
USD/JPY daily chart


Comments
Log in or sign up to join the conversation.