


The ETF has recently given us a Double Three pullback and found buyers again precisely at the equal legs area, as we expected. In the following text, we’ll explain the Elliott Wave count.
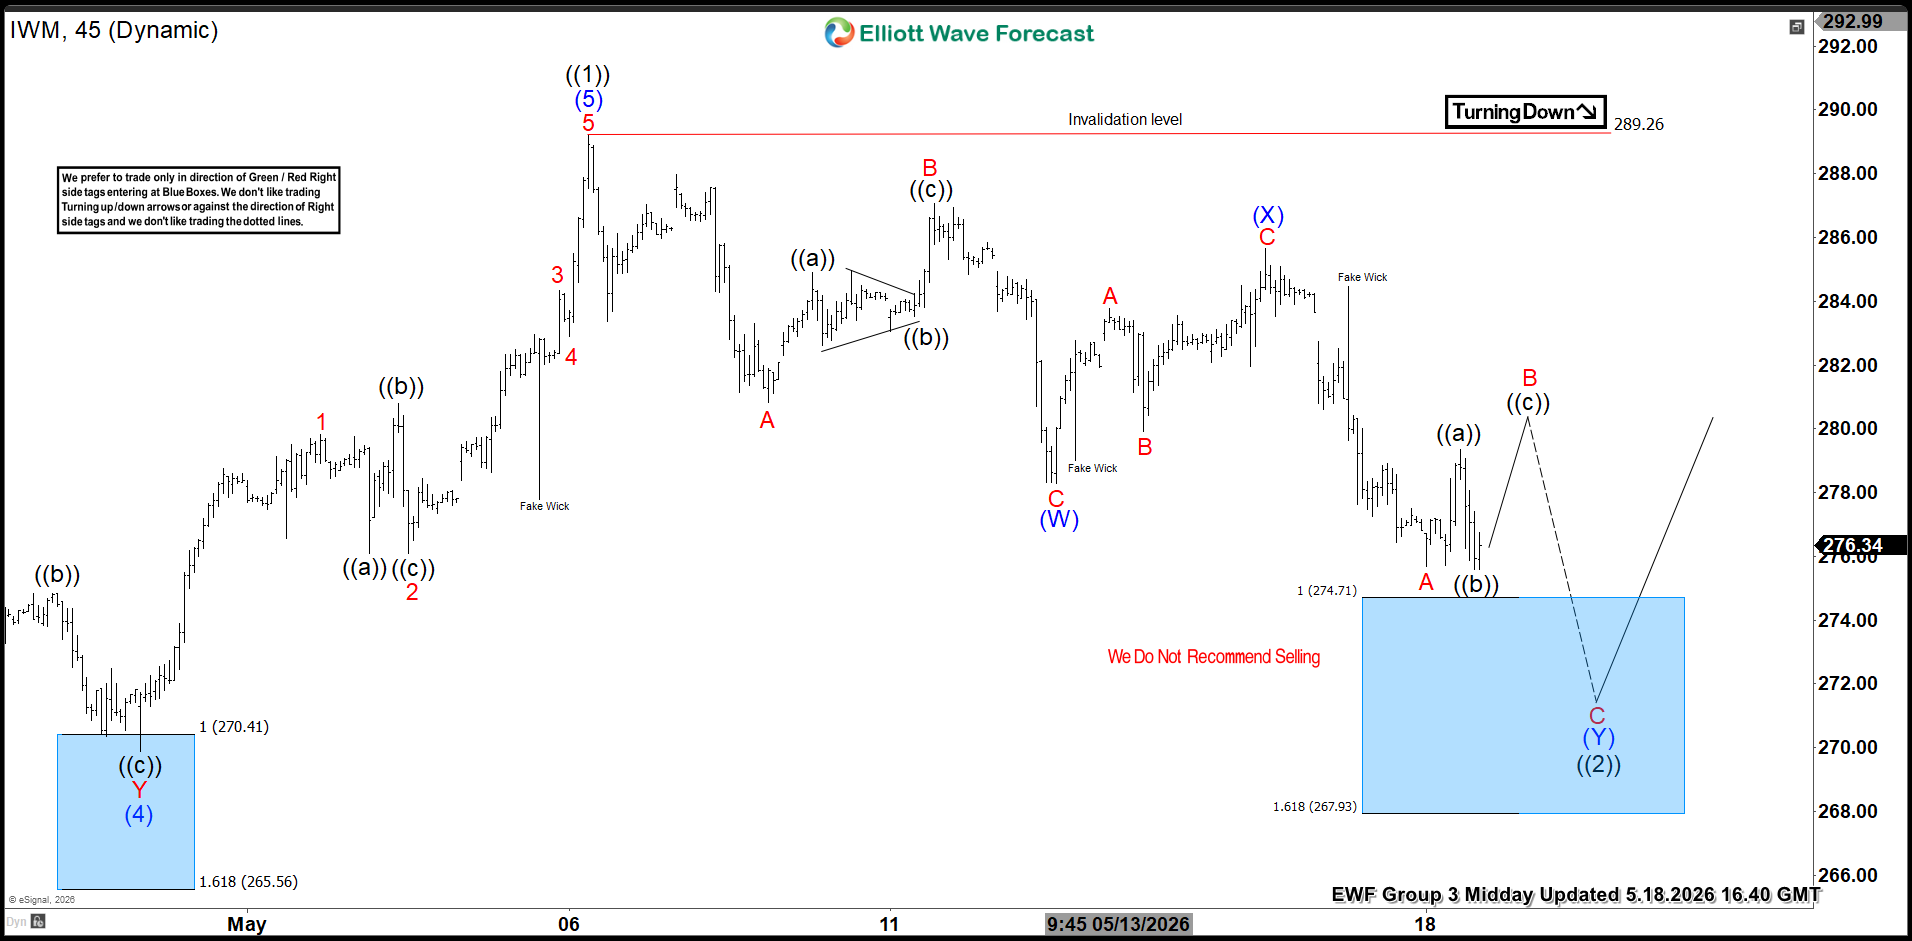
IWM Elliott Wave 1 Hour Chart 05.18.2026
The ETF is forming a 3-wave pullback, unfolding as a Double Three pattern. At the moment, we can see incomplete sequences. Our members know that we constantly emphasize the importance of incomplete sequences, as these determine the market’s path.
The structure suggests more weakness toward the Equal Legs area at 274.71-267.93, buying zone. We expect at least a three-wave bounce from the Blue Box area. Once the price reaches the 50% Fibonacci retracement against the (X) connector, we will make the position risk-free by moving the stop loss to breakeven and booking partial profits.
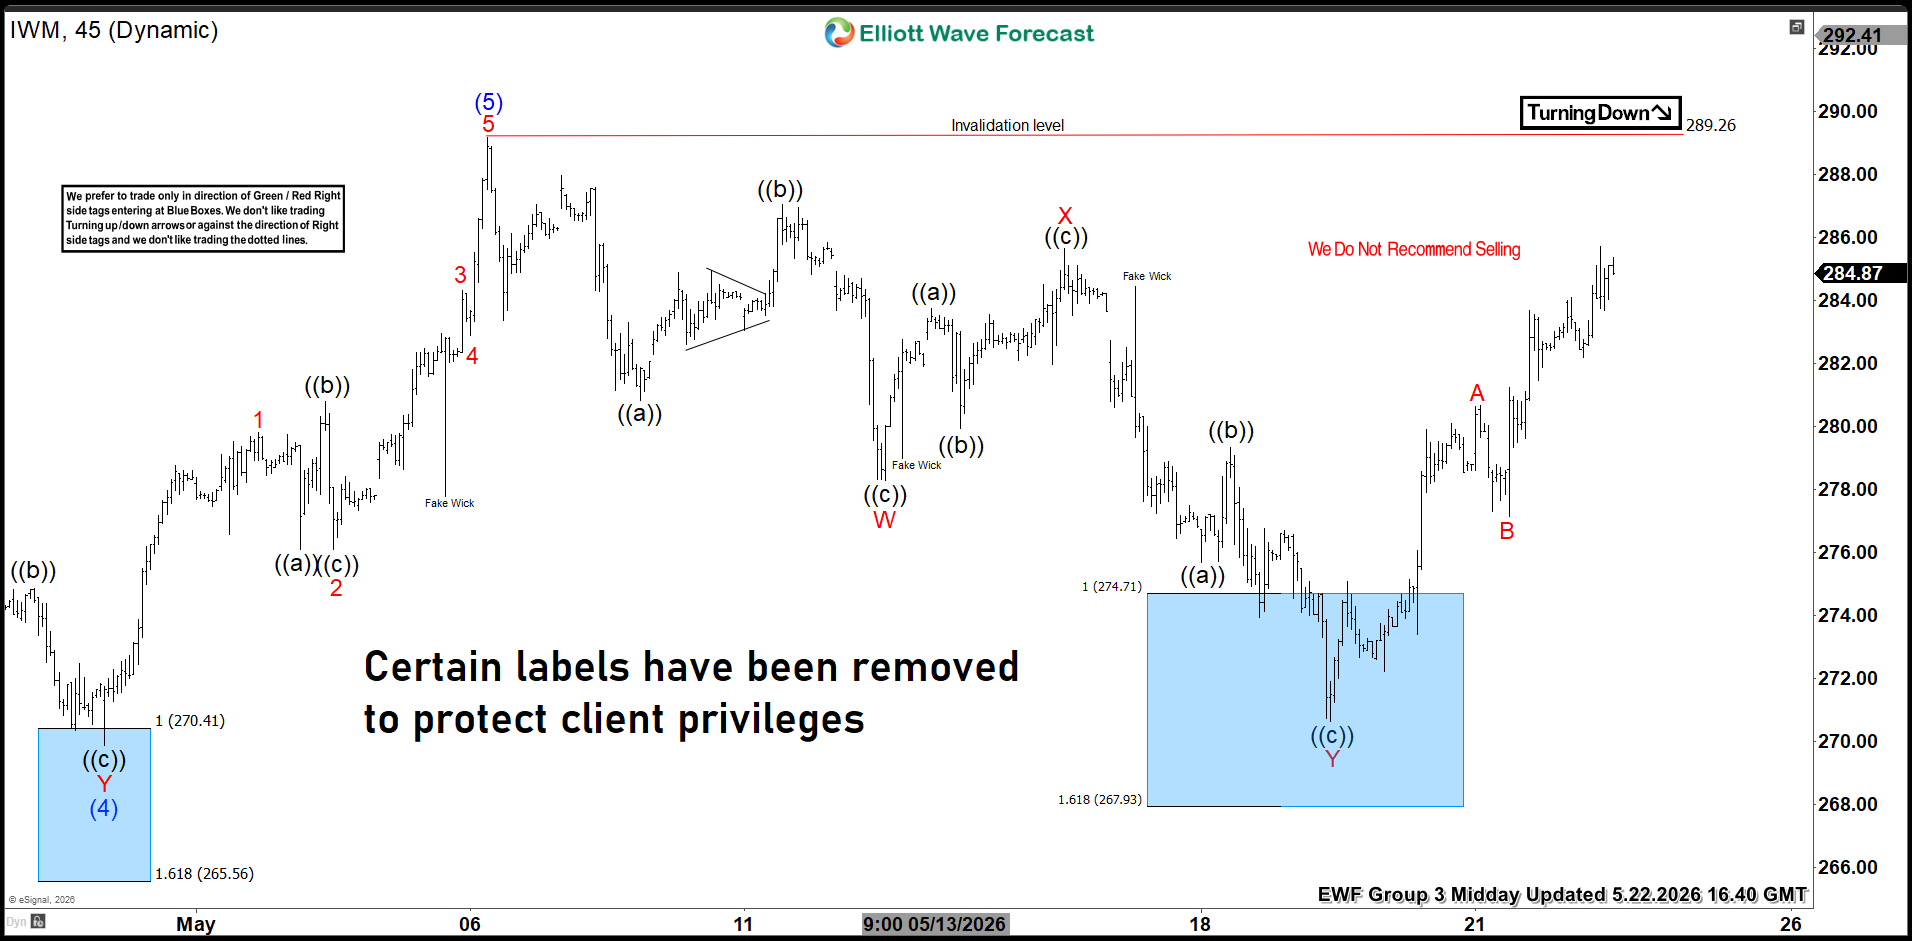
IWM Elliott Wave 1 Hour Chart 05.22.2026
IWM made a proposed leg down and found buyers as expected at the Blue Box area, making a decent bounce. Any longs from the blue box zone should be risk-free. 289.26 is the key level at this stage. A break above this peak would confirm a bullish continuation for the ETF and open the door for further upside extensions.
Thank you for exploring our IWM technical article with us.



Comments
Log in or sign up to join the conversation.