

Hello Traders! Today, we will look at the 4H Elliott Wave structure of iShares 20+ Year Bond ETF ($TLT) and explain why the ETF should see more upside after pulling back in a Zig-Zag correction and reaching the Blue Box area.
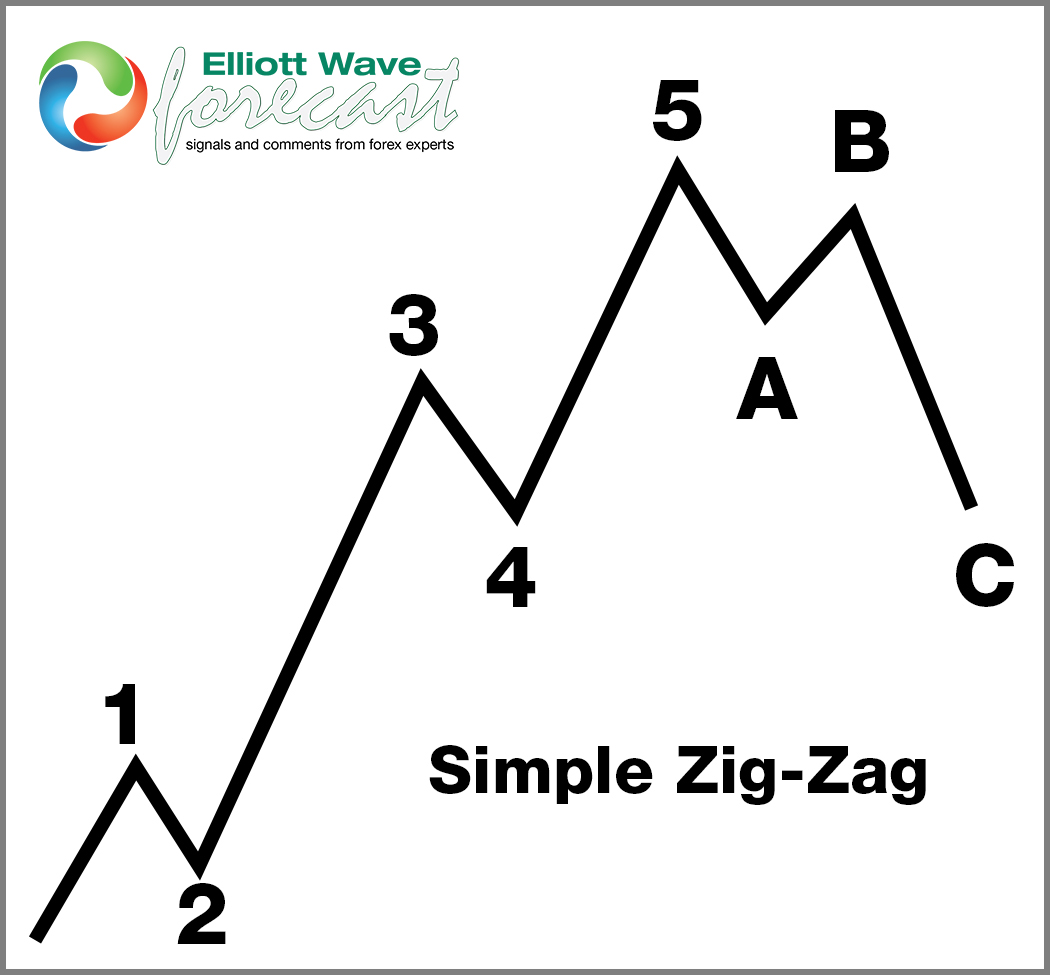
5 Wave Impulse Structure + ABC correction
$TLT 4H Elliott Wave View – June 04, 2024:
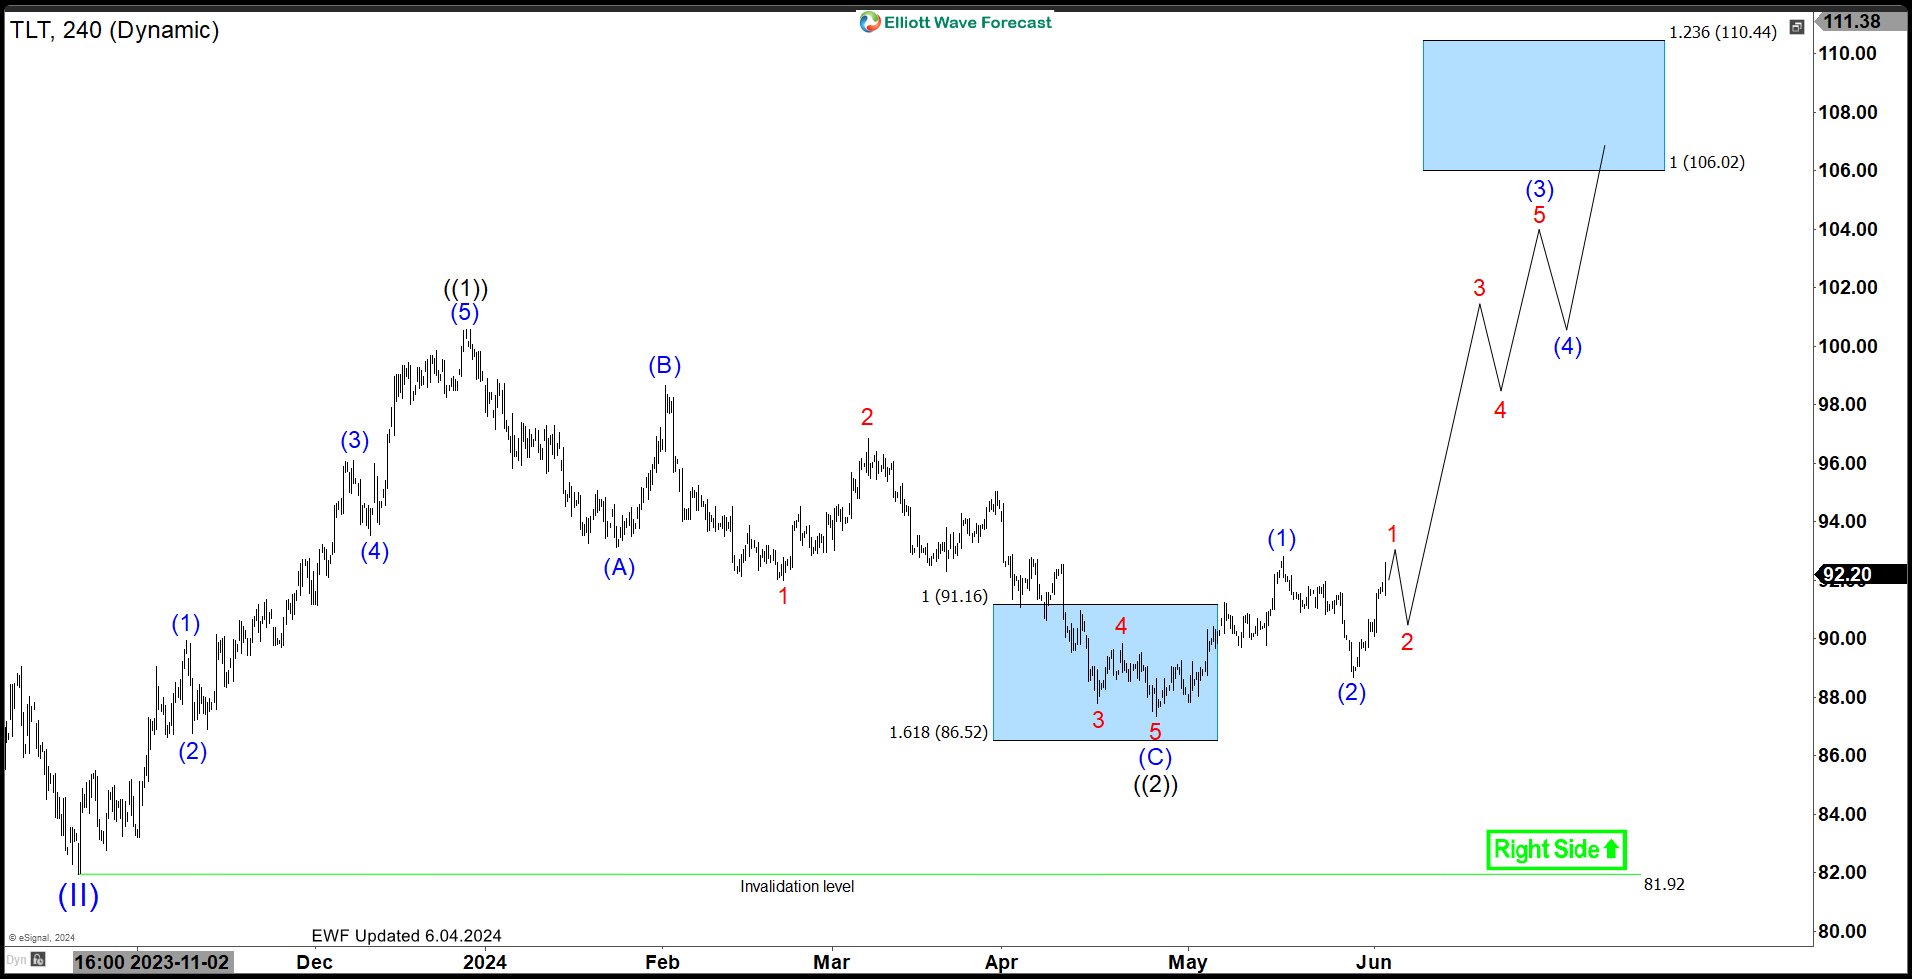
The 4H chart above shows the cycle from Oct 2023 low unfold as a 5 waves impulse suggesting a bullish sequence. Firstly, the rally peaked on Dec 2023 and started a Zig-Zag correction. Secondly, the pullback managed to reach the blue box area at $91.16 - 86.52. As a result, buyers entered and pushed price higher again in an impulse. Consequently, ending the correction on 4/25/2024. In conclusion, the ETF is favored to pullback soon to correct the cycle from 5/29/2024 low before continuing higher towards $106 - 110 area.



Comments
Log in or sign up to join the conversation.