

The Fed is about to raise rates Wednesday. The yield curve will flatten even more in the next few days if the Fed stays consistent with its plan to raise rates 3 times this year. The current difference between the 2-year bond yield and the 10-year bond yield is 85 basis points. I have said a 10% correction in the S&P 500 is possible if it falls below 75 basis points. The chart below shows the process of the yield curve flattening as the Fed raises rates. According to Citi Research and Bloomberg, we’re almost 30% through the Fed tightening cycle. There’s still about 100 basis points more for the yield curve to flatten and then invert if the cycle matches the average.
(Click on image to enlarge)
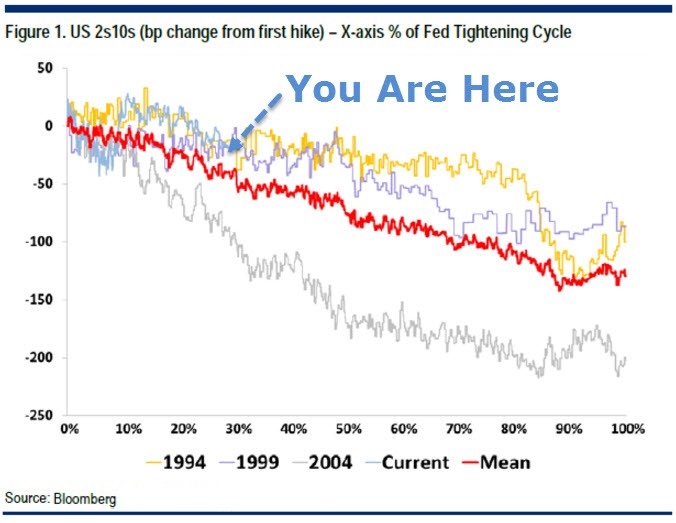
I don’t see this tightening cycle playing out anything like the prior few, so the chart above might be worthless for forecasting the direction of the yield curve. The chart below supports my claim as it shows the advanced 6 quarters real GDP growth falling. The core CPI will probably fall along with the real GDP growth as it has already been falling for a few months and because it has been highly correlated with real GDP growth historically. If GDP growth and CPI fall in the 2nd half of the year, the Fed might rethink its 3rdhike and will definitely pause further rate hikes in early 2018. Each chart I show which shows disinflation furthers the evidence that the Fed won’t be able to ignore this. The best way to ignore a trend is to show an indicator which isn’t consistent with the others, but if they all show the same trend, it’s impossible to ignore. The mere mention that disinflation is a real trend will cause the market to see the Fed as being dovish.
(Click on image to enlarge)

In terms of the yield curve, the Fed pausing rate hikes would steepen it on the short end. The weak economic data would flatten it on the long end. The result of this would depend on how dovish the Fed becomes and how bad the economic data is. This is all speculation as I lean towards the idea of the Fed becoming more dovish in its next meeting. If the Fed is hawkish, the yield curve can easily invert by the end of the year if the economic data disappoints.
There’s no use in only harping on the U.S. macro surprise index which is clearly looking terrible. The chart below is the weekly leading index. It uses a few economic reports like the ISM and the number of small businesses created versus the number of large businesses failing, to come up with a gauge of the economy. The ECRI Institute used this indicator to predict the early 2000s recession and the 2008 recession. It also made a mistake by using this indicator to predict a recession in 2011/2012 which didn’t pan out. If you look at this current recovery compared to the prior ones, there have been much more readings which were negative in this cycle. That’s what happens when the economy’s long run average GDP growth falls below 2%. Declining population growth rates and productivity are the cause of this new long-term trend. It’s not just America which is experiencing this trend. It’s a trend in Europe and Japan as well. With this trend in place, we’re seeing expensive valuations. This combination of low growth and high valuations make me think this is a big bubble which will end in despair.
(Click on image to enlarge)

The key determination of when the bubble will unwind is credit impulses. Without credit expanding to unprecedented levels, this moribund global economy would stall. As you can see from the chart below, the credit impulses have gone negative. This means in rate of change terms the growth in credit has slowed. This change has been driven by China which has stepped off the gas pedal, possibly because it couldn’t keep the bubble going as it has grown to 3 times the size of the American subprime bubble.
(Click on image to enlarge)

The chart below shows C&I lending and commercial real estate prices stalling. The question is when that stall turns into a downturn. The next commercial real estate downturn will likely be in between the last two cycles. It didn’t fall in the early 2000s recession because that one was mild; it crashed hard in the 2008 recession because of the housing bust. Low interest rates and the overbuilding of apartments in the last few months despite high rent costs (which hurt demand) should push commercial real estate lower in the next few months, but I’m not expecting a crash like 2008. The C&I lending growth appears to be rebounding, but it’s still not at its peak it reached in November 2016.
(Click on image to enlarge)

The latest mini bump up in C&I lending has been caused by the loosening of standards seen in the chart below. The reason for the decline in lending recently appears to be declining demand for loans. I think a recession is more likely to be caused by tightening standards than a decline in demand. This might mean a recession isn’t as close as the C&I lending peak makes it look like it is. I look at tightening standards caused by increasing delinquencies to judge if the credit cycle is ending soon. If the standards continue to loosen, the November high will be passed.
(Click on image to enlarge)

Conclusion
The lending conditions are loose as the Fed has rates relatively low and the other central banks, particularly the ECB, pump liquidity into the system. So far, the decline in credit growth hasn’t caused the weekly leading index to fall negative. I see the Fed as a potential bullish catalyst for the stock market because disinflation may cause it to be more dovish. This would ruin the hike cycle, but this recovery hasn’t been normal anyway, so that wouldn’t be shocking. The unwind has caused long term yields to fall which flattens the yield curve. I don’t see the Fed stopping the unwind to boost long term rates, because that would be admitting its policies are causing the opposite effect of what it wants.


Comments
Log in or sign up to join the conversation.